29
/
en
AIzaSyAYiBZKx7MnpbEhh9jyipgxe19OcubqV5w
April 1, 2024
258738
Syrian Arab Republic
SYR
true
2
1
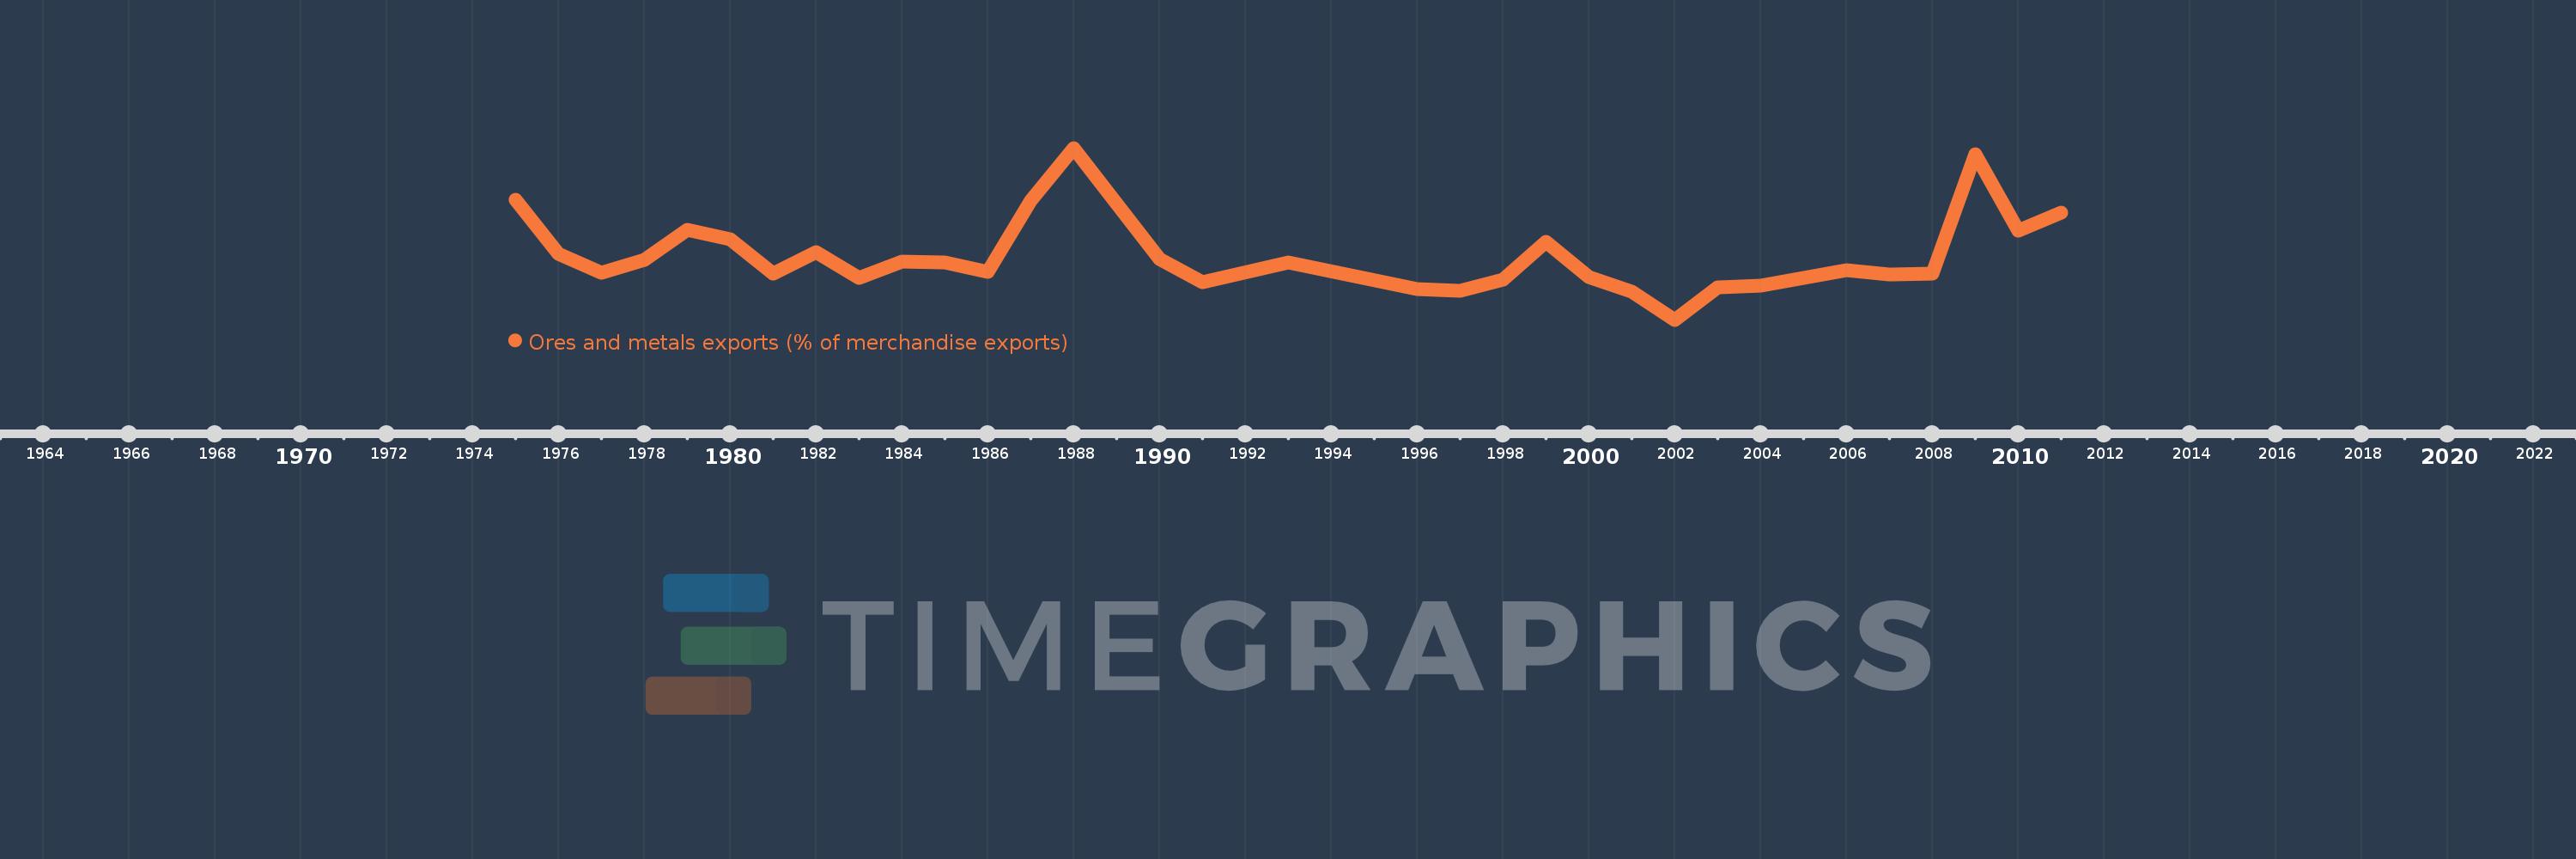
Ores and metals exports (% of merchandise exports)
2011,2010,2009,2008,2007,2006,2005,2004,2003,2002,2001,2000,1999,1998,1997,1996,1993,1991,1990,1988,1987,1986,1985,1984,1983,1982,1981,1980,1979,1978,1977,1976,1975
This statistics in other country:
AfghanistanAlbaniaAlgeriaAndorraAngolaAntigua and BarbudaArab WorldArgentinaArmeniaArubaAustraliaAustriaAzerbaijanBahamas, TheBahrainBangladeshBarbadosBelarusBelgiumBelizeBeninBermudaBhutanBoliviaBosnia and HerzegovinaBotswanaBrazilBrunei DarussalamBulgariaBurkina FasoBurundiCabo VerdeCambodiaCameroonCanadaCaribbean small statesCayman IslandsCentral African RepublicCentral Europe and the BalticsChadChileChinaColombiaComorosCongo, Dem. Rep.Congo, Rep.Costa RicaCote d'IvoireCroatiaCubaCyprusCzech RepublicDenmarkDjiboutiDominicaDominican RepublicEarly-demographic dividendEast Asia & PacificEast Asia & Pacific (excluding high income)East Asia & Pacific (IDA & IBRD countries)EcuadorEgypt, Arab Rep.El SalvadorEquatorial GuineaEritreaEstoniaEthiopiaEuro areaEurope & Central AsiaEurope & Central Asia (excluding high income)Europe & Central Asia (IDA & IBRD countries)European UnionFaroe IslandsFijiFinlandFragile and conflict affected situationsFranceFrench PolynesiaGabonGambia, TheGeorgiaGermanyGhanaGreeceGreenlandGrenadaGuatemalaGuineaGuinea-BissauGuyanaHaitiHeavily indebted poor countries (HIPC)High incomeHondurasHong Kong SAR, ChinaHungaryIBRD onlyIcelandIDA & IBRD totalIDA blendIDA onlyIDA totalIndiaIndonesiaIran, Islamic Rep.IraqIrelandIsraelItalyJamaicaJapanJordanKazakhstanKenyaKiribatiKorea, Rep.KuwaitKyrgyz RepublicLao PDRLate-demographic dividendLatin America & Caribbean Latin America & Caribbean (excluding high income)Latin America & the Caribbean (IDA & IBRD countries)LatviaLeast developed countries: UN classificationLebanonLesothoLiberiaLibyaLithuaniaLow & middle incomeLower middle incomeLuxembourgMacao SAR, ChinaMacedonia, FYRMadagascarMalawiMalaysiaMaldivesMaliMaltaMauritaniaMauritiusMexicoMiddle East & North AfricaMiddle East & North Africa (excluding high income)Middle East & North Africa (IDA & IBRD countries)Middle incomeMoldovaMongoliaMoroccoMozambiqueMyanmarNamibiaNepalNetherlandsNew CaledoniaNew ZealandNicaraguaNigerNigeriaNorth AmericaNorwayOECD membersOmanOther small statesPacific island small statesPakistanPalauPanamaPapua New GuineaParaguayPeruPhilippinesPolandPortugalPost-demographic dividendPre-demographic dividendQatarRomaniaRussian FederationRwandaSamoaSao Tome and PrincipeSaudi ArabiaSenegalSerbiaSeychellesSierra LeoneSingaporeSlovak RepublicSloveniaSmall statesSolomon IslandsSomaliaSouth AfricaSouth AsiaSouth Asia (IDA & IBRD)SpainSri LankaSt. Kitts and NevisSt. LuciaSt. Vincent and the GrenadinesSub-Saharan Africa Sub-Saharan Africa (excluding high income)Sub-Saharan Africa (IDA & IBRD countries)SudanSurinameSwazilandSwedenSwitzerlandSyrian Arab RepublicTajikistanTanzaniaThailandTimor-LesteTogoTongaTrinidad and TobagoTunisiaTurkeyTurkmenistanTurks and Caicos IslandsUgandaUkraineUnited Arab EmiratesUnited KingdomUnited StatesUpper middle incomeUruguayVanuatuVenezuela, RBVietnamVirgin Islands (U.S.)WorldYemen, Rep.ZambiaZimbabwe Timeline:
This timeline shows a graph from 1975 to 2011 of Syrian Arab Republic. No data until 1974. Number of actual observations by date: 33.
Source name:
World Development Indicators
Source organization:
World Bank staff estimates from the Comtrade database maintained by the United Nations Statistics Division.
Categories, topics:
Energy & Mining, Private Sector, Trade
Last updated:
apr 23, 2017
Indicators value changes by year
At the date of observation
Value
Absolute change
Change from previous value
jan 1, 1975
2.964
+2.964
0.0%
jan 1, 1976
1.648
-1.317
-44.42%
jan 1, 1977
1.197
-0.45
-27.33%
jan 1, 1978
1.497
+0.299
25.01%
jan 1, 1979
2.238
+0.742
49.55%
jan 1, 1980
2.006
-0.232
-10.37%
jan 1, 1981
1.174
-0.832
-41.47%
jan 1, 1982
1.699
+0.525
44.7%
jan 1, 1983
1.073
-0.626
-36.85%
jan 1, 1984
1.465
+0.392
36.57%
jan 1, 1985
1.446
-0.02
-1.34%
jan 1, 1986
1.219
-0.227
-15.69%
jan 1, 1987
2.945
+1.726
141.57%
jan 1, 1988
4.235
+1.291
43.83%
jan 1, 1990
1.533
-2.703
-63.81%
jan 1, 1991
0.965
-0.568
-37.06%
jan 1, 1993
1.452
+0.487
50.49%
jan 1, 1996
0.785
-0.666
-45.89%
jan 1, 1997
0.759
-0.026
-3.35%
jan 1, 1998
1.023
+0.264
34.76%
jan 1, 1999
1.951
+0.928
90.69%
jan 1, 2000
1.075
-0.876
-44.92%
jan 1, 2001
0.732
-0.342
-31.85%
jan 1, 2002
0.044
-0.688
-94.02%
jan 1, 2003
0.828
+0.784
1.79K%
jan 1, 2004
0.869
+0.042
5.01%
jan 1, 2005
1.063
+0.194
22.28%
jan 1, 2006
1.26
+0.197
18.51%
jan 1, 2007
1.153
-0.106
-8.42%
jan 1, 2008
1.169
+0.016
1.39%
jan 1, 2009
4.091
+2.922
249.85%
jan 1, 2010
2.207
-1.884
-46.05%
jan 1, 2011
2.664
+0.457
20.68%
Ranking of countries by current statistics by years


Comments: