29
/
en
AIzaSyAYiBZKx7MnpbEhh9jyipgxe19OcubqV5w
April 1, 2024
167935
Kenya
KEN
true
2
1
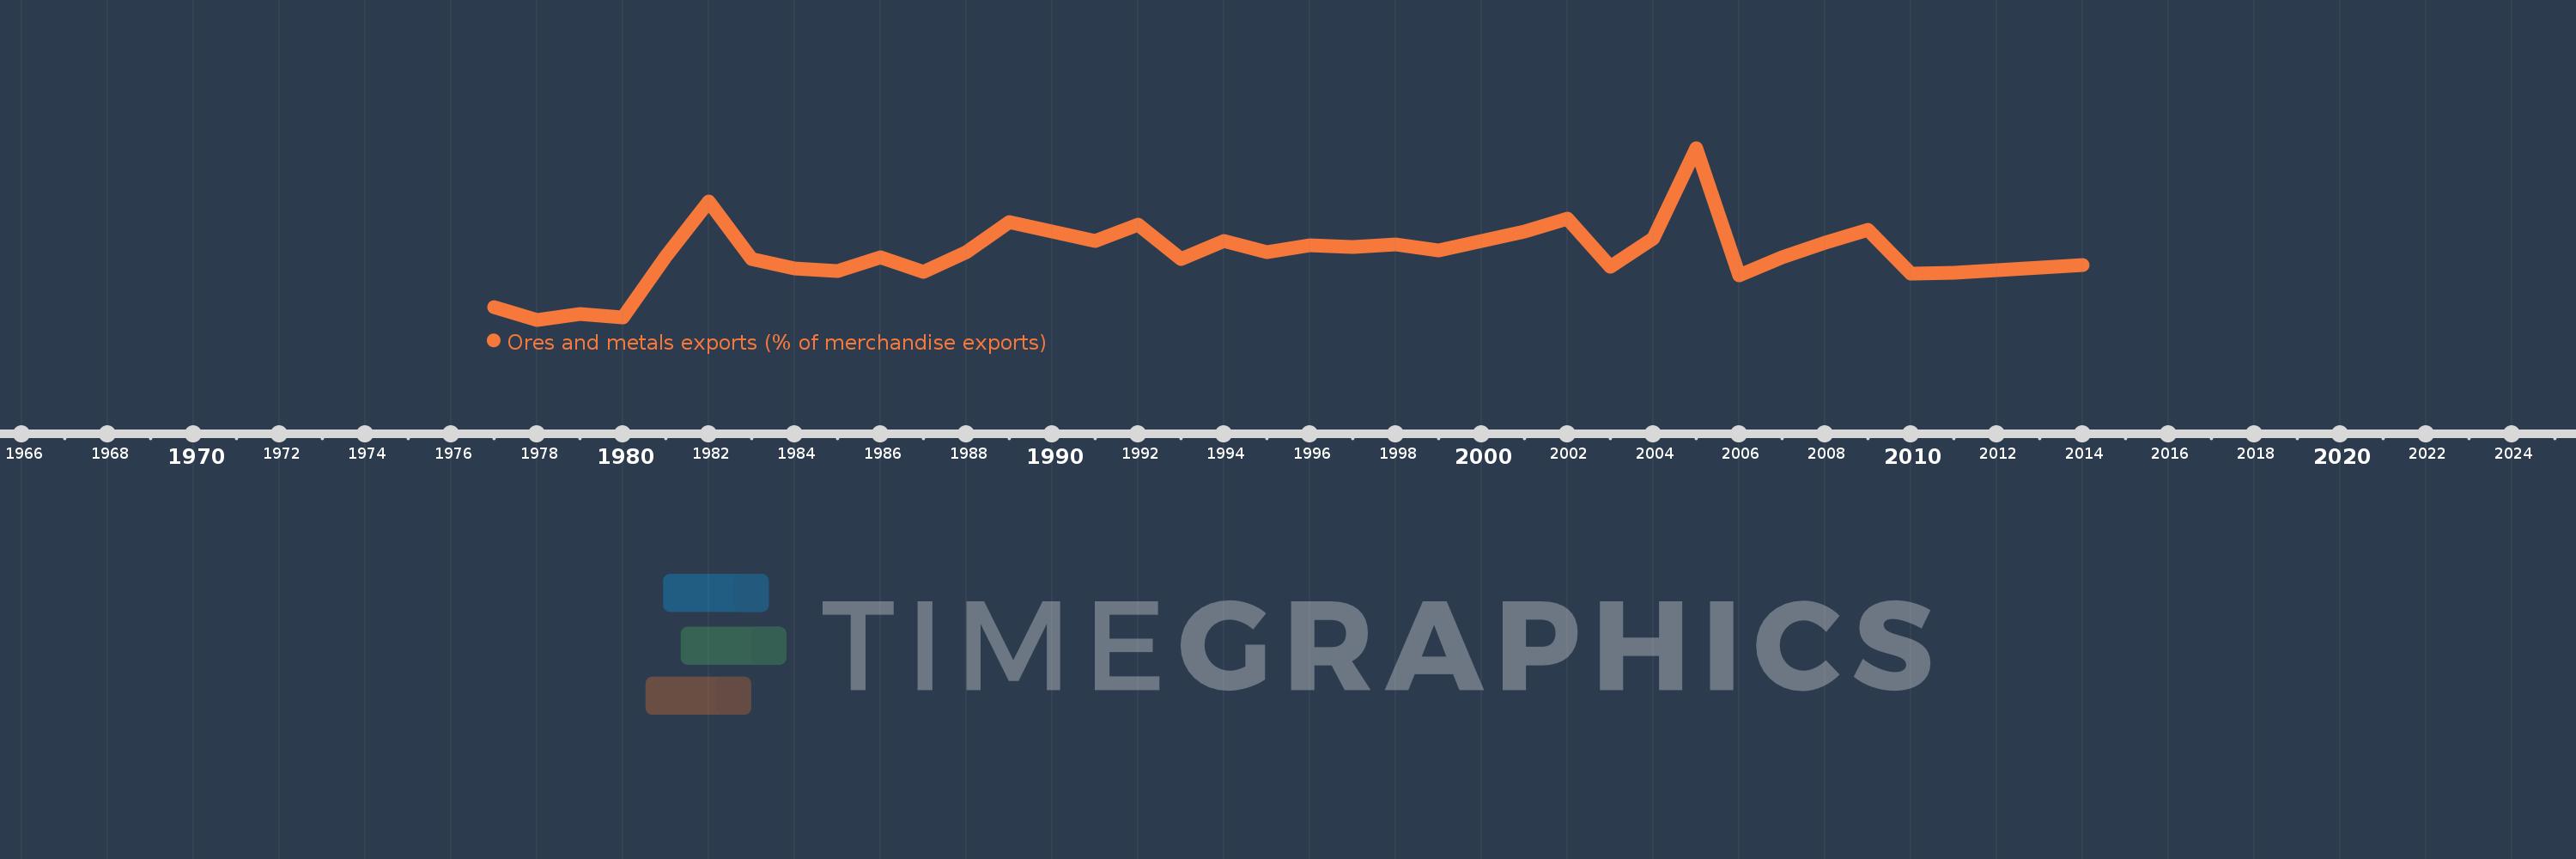
Ores and metals exports (% of merchandise exports)
2014,2011,2010,2009,2008,2007,2006,2005,2004,2003,2002,2001,2000,1999,1998,1997,1996,1995,1994,1993,1992,1991,1989,1988,1987,1986,1985,1984,1983,1982,1981,1980,1979,1978,1977
This statistics in other country:
AfghanistanAlbaniaAlgeriaAndorraAngolaAntigua and BarbudaArab WorldArgentinaArmeniaArubaAustraliaAustriaAzerbaijanBahamas, TheBahrainBangladeshBarbadosBelarusBelgiumBelizeBeninBermudaBhutanBoliviaBosnia and HerzegovinaBotswanaBrazilBrunei DarussalamBulgariaBurkina FasoBurundiCabo VerdeCambodiaCameroonCanadaCaribbean small statesCayman IslandsCentral African RepublicCentral Europe and the BalticsChadChileChinaColombiaComorosCongo, Dem. Rep.Congo, Rep.Costa RicaCote d'IvoireCroatiaCubaCyprusCzech RepublicDenmarkDjiboutiDominicaDominican RepublicEarly-demographic dividendEast Asia & PacificEast Asia & Pacific (excluding high income)East Asia & Pacific (IDA & IBRD countries)EcuadorEgypt, Arab Rep.El SalvadorEquatorial GuineaEritreaEstoniaEthiopiaEuro areaEurope & Central AsiaEurope & Central Asia (excluding high income)Europe & Central Asia (IDA & IBRD countries)European UnionFaroe IslandsFijiFinlandFragile and conflict affected situationsFranceFrench PolynesiaGabonGambia, TheGeorgiaGermanyGhanaGreeceGreenlandGrenadaGuatemalaGuineaGuinea-BissauGuyanaHaitiHeavily indebted poor countries (HIPC)High incomeHondurasHong Kong SAR, ChinaHungaryIBRD onlyIcelandIDA & IBRD totalIDA blendIDA onlyIDA totalIndiaIndonesiaIran, Islamic Rep.IraqIrelandIsraelItalyJamaicaJapanJordanKazakhstanKenyaKiribatiKorea, Rep.KuwaitKyrgyz RepublicLao PDRLate-demographic dividendLatin America & Caribbean Latin America & Caribbean (excluding high income)Latin America & the Caribbean (IDA & IBRD countries)LatviaLeast developed countries: UN classificationLebanonLesothoLiberiaLibyaLithuaniaLow & middle incomeLower middle incomeLuxembourgMacao SAR, ChinaMacedonia, FYRMadagascarMalawiMalaysiaMaldivesMaliMaltaMauritaniaMauritiusMexicoMiddle East & North AfricaMiddle East & North Africa (excluding high income)Middle East & North Africa (IDA & IBRD countries)Middle incomeMoldovaMongoliaMoroccoMozambiqueMyanmarNamibiaNepalNetherlandsNew CaledoniaNew ZealandNicaraguaNigerNigeriaNorth AmericaNorwayOECD membersOmanOther small statesPacific island small statesPakistanPalauPanamaPapua New GuineaParaguayPeruPhilippinesPolandPortugalPost-demographic dividendPre-demographic dividendQatarRomaniaRussian FederationRwandaSamoaSao Tome and PrincipeSaudi ArabiaSenegalSerbiaSeychellesSierra LeoneSingaporeSlovak RepublicSloveniaSmall statesSolomon IslandsSomaliaSouth AfricaSouth AsiaSouth Asia (IDA & IBRD)SpainSri LankaSt. Kitts and NevisSt. LuciaSt. Vincent and the GrenadinesSub-Saharan Africa Sub-Saharan Africa (excluding high income)Sub-Saharan Africa (IDA & IBRD countries)SudanSurinameSwazilandSwedenSwitzerlandSyrian Arab RepublicTajikistanTanzaniaThailandTimor-LesteTogoTongaTrinidad and TobagoTunisiaTurkeyTurkmenistanTurks and Caicos IslandsUgandaUkraineUnited Arab EmiratesUnited KingdomUnited StatesUpper middle incomeUruguayVanuatuVenezuela, RBVietnamVirgin Islands (U.S.)WorldYemen, Rep.ZambiaZimbabwe Timeline:
This timeline shows a graph from 1977 to 2014 of Kenya. No data until 1976. Number of actual observations by date: 35.
Source name:
World Development Indicators
Source organization:
World Bank staff estimates from the Comtrade database maintained by the United Nations Statistics Division.
Categories, topics:
Energy & Mining, Private Sector, Trade
Last updated:
apr 23, 2017
Indicators value changes by year
At the date of observation
Value
Absolute change
Change from previous value
jan 1, 1977
1.051
+1.051
0.0%
jan 1, 1978
0.7
-0.351
-33.4%
jan 1, 1979
0.857
+0.156
22.33%
jan 1, 1980
0.761
-0.096
-11.16%
jan 1, 1981
2.477
+1.716
225.45%
jan 1, 1982
4.012
+1.535
61.95%
jan 1, 1983
2.397
-1.615
-40.25%
jan 1, 1984
2.13
-0.267
-11.13%
jan 1, 1985
2.064
-0.066
-3.11%
jan 1, 1986
2.445
+0.381
18.47%
jan 1, 1987
2.051
-0.394
-16.13%
jan 1, 1988
2.597
+0.547
26.65%
jan 1, 1989
3.439
+0.842
32.43%
jan 1, 1991
2.905
-0.535
-15.55%
jan 1, 1992
3.372
+0.468
16.1%
jan 1, 1993
2.404
-0.968
-28.71%
jan 1, 1994
2.912
+0.508
21.15%
jan 1, 1995
2.607
-0.305
-10.47%
jan 1, 1996
2.8
+0.193
7.41%
jan 1, 1997
2.751
-0.049
-1.75%
jan 1, 1998
2.825
+0.074
2.68%
jan 1, 1999
2.649
-0.176
-6.24%
jan 1, 2000
2.91
+0.261
9.85%
jan 1, 2001
3.174
+0.264
9.08%
jan 1, 2002
3.532
+0.358
11.28%
jan 1, 2003
2.19
-1.342
-38.0%
jan 1, 2004
2.972
+0.782
35.69%
jan 1, 2005
5.523
+2.551
85.85%
jan 1, 2006
1.939
-3.583
-64.89%
jan 1, 2007
2.464
+0.525
27.07%
jan 1, 2008
2.865
+0.4
16.24%
jan 1, 2009
3.227
+0.363
12.66%
jan 1, 2010
1.995
-1.232
-38.16%
jan 1, 2011
2.03
+0.035
1.75%
jan 1, 2014
2.243
+0.213
10.49%
Ranking of countries by current statistics by years


Comments: