29
/
en
AIzaSyAYiBZKx7MnpbEhh9jyipgxe19OcubqV5w
April 1, 2024
170332
Korea, Rep.
KOR
true
2
1
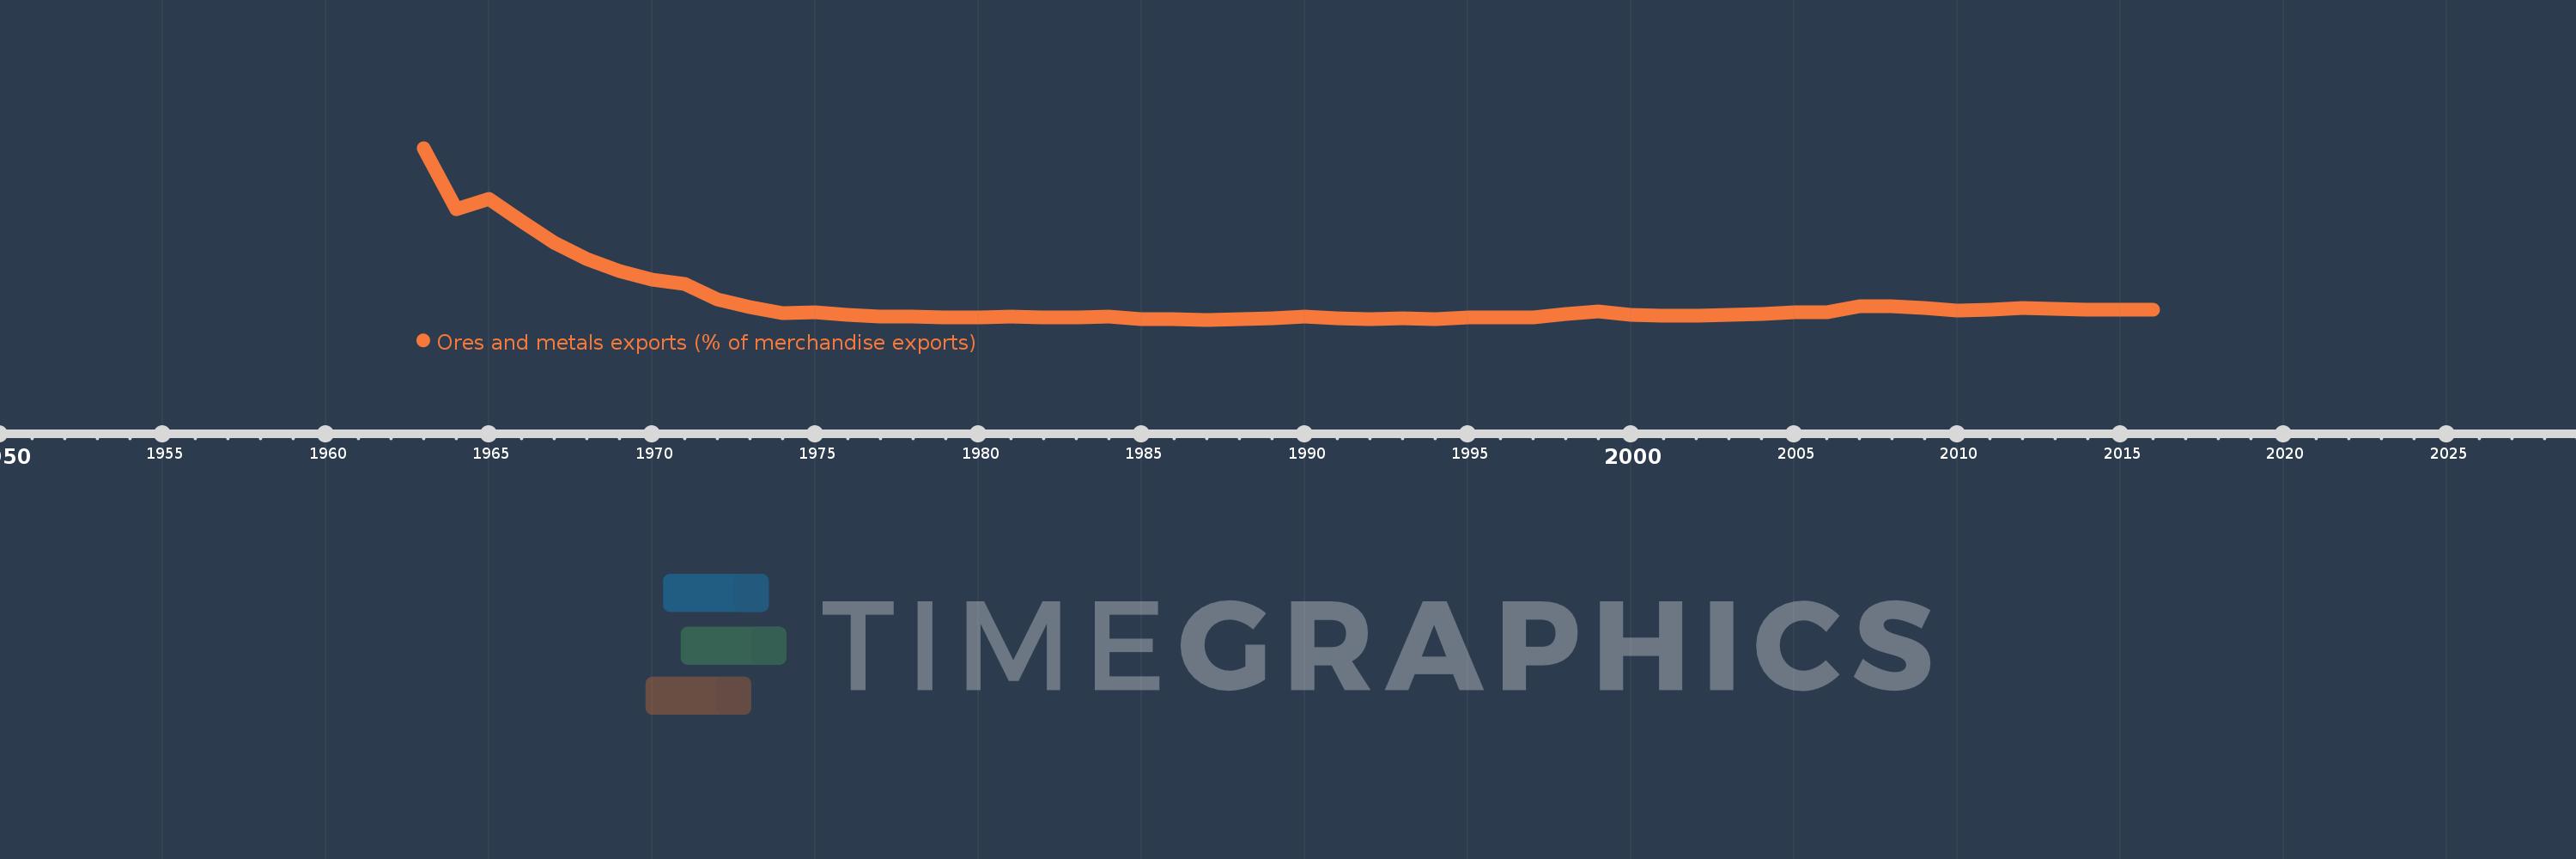
Ores and metals exports (% of merchandise exports)
2016,2015,2014,2013,2012,2011,2010,2009,2008,2007,2006,2005,2004,2003,2002,2001,2000,1999,1998,1997,1996,1995,1994,1993,1992,1991,1990,1989,1988,1987,1986,1985,1984,1983,1982,1981,1980,1979,1978,1977,1976,1975,1974,1973,1972,1971,1970,1969,1968,1967,1966,1965,1964,1963
This statistics in other country:
AfghanistanAlbaniaAlgeriaAndorraAngolaAntigua and BarbudaArab WorldArgentinaArmeniaArubaAustraliaAustriaAzerbaijanBahamas, TheBahrainBangladeshBarbadosBelarusBelgiumBelizeBeninBermudaBhutanBoliviaBosnia and HerzegovinaBotswanaBrazilBrunei DarussalamBulgariaBurkina FasoBurundiCabo VerdeCambodiaCameroonCanadaCaribbean small statesCayman IslandsCentral African RepublicCentral Europe and the BalticsChadChileChinaColombiaComorosCongo, Dem. Rep.Congo, Rep.Costa RicaCote d'IvoireCroatiaCubaCyprusCzech RepublicDenmarkDjiboutiDominicaDominican RepublicEarly-demographic dividendEast Asia & PacificEast Asia & Pacific (excluding high income)East Asia & Pacific (IDA & IBRD countries)EcuadorEgypt, Arab Rep.El SalvadorEquatorial GuineaEritreaEstoniaEthiopiaEuro areaEurope & Central AsiaEurope & Central Asia (excluding high income)Europe & Central Asia (IDA & IBRD countries)European UnionFaroe IslandsFijiFinlandFragile and conflict affected situationsFranceFrench PolynesiaGabonGambia, TheGeorgiaGermanyGhanaGreeceGreenlandGrenadaGuatemalaGuineaGuinea-BissauGuyanaHaitiHeavily indebted poor countries (HIPC)High incomeHondurasHong Kong SAR, ChinaHungaryIBRD onlyIcelandIDA & IBRD totalIDA blendIDA onlyIDA totalIndiaIndonesiaIran, Islamic Rep.IraqIrelandIsraelItalyJamaicaJapanJordanKazakhstanKenyaKiribatiKorea, Rep.KuwaitKyrgyz RepublicLao PDRLate-demographic dividendLatin America & Caribbean Latin America & Caribbean (excluding high income)Latin America & the Caribbean (IDA & IBRD countries)LatviaLeast developed countries: UN classificationLebanonLesothoLiberiaLibyaLithuaniaLow & middle incomeLower middle incomeLuxembourgMacao SAR, ChinaMacedonia, FYRMadagascarMalawiMalaysiaMaldivesMaliMaltaMauritaniaMauritiusMexicoMiddle East & North AfricaMiddle East & North Africa (excluding high income)Middle East & North Africa (IDA & IBRD countries)Middle incomeMoldovaMongoliaMoroccoMozambiqueMyanmarNamibiaNepalNetherlandsNew CaledoniaNew ZealandNicaraguaNigerNigeriaNorth AmericaNorwayOECD membersOmanOther small statesPacific island small statesPakistanPalauPanamaPapua New GuineaParaguayPeruPhilippinesPolandPortugalPost-demographic dividendPre-demographic dividendQatarRomaniaRussian FederationRwandaSamoaSao Tome and PrincipeSaudi ArabiaSenegalSerbiaSeychellesSierra LeoneSingaporeSlovak RepublicSloveniaSmall statesSolomon IslandsSomaliaSouth AfricaSouth AsiaSouth Asia (IDA & IBRD)SpainSri LankaSt. Kitts and NevisSt. LuciaSt. Vincent and the GrenadinesSub-Saharan Africa Sub-Saharan Africa (excluding high income)Sub-Saharan Africa (IDA & IBRD countries)SudanSurinameSwazilandSwedenSwitzerlandSyrian Arab RepublicTajikistanTanzaniaThailandTimor-LesteTogoTongaTrinidad and TobagoTunisiaTurkeyTurkmenistanTurks and Caicos IslandsUgandaUkraineUnited Arab EmiratesUnited KingdomUnited StatesUpper middle incomeUruguayVanuatuVenezuela, RBVietnamVirgin Islands (U.S.)WorldYemen, Rep.ZambiaZimbabwe Timeline:
This timeline shows a graph from 1963 to 2016 of Korea, Rep.. No data until 1962. Number of actual observations by date: 54.
Source name:
World Development Indicators
Source organization:
World Bank staff estimates from the Comtrade database maintained by the United Nations Statistics Division.
Categories, topics:
Energy & Mining, Private Sector, Trade
Last updated:
apr 23, 2017
Indicators value changes by year
Maximum:
24.407
jan 1, 1963
At the date of observation
Value
Absolute change
Change from previous value
jan 1, 1963
24.407
+24.407
0.0%
jan 1, 1964
15.928
-8.479
-34.74%
jan 1, 1965
17.317
+1.389
8.72%
jan 1, 1966
14.286
-3.031
-17.5%
jan 1, 1967
11.303
-2.982
-20.88%
jan 1, 1968
9.089
-2.214
-19.59%
jan 1, 1969
7.369
-1.72
-18.92%
jan 1, 1970
6.262
-1.107
-15.02%
jan 1, 1971
5.667
-0.596
-9.51%
jan 1, 1972
3.458
-2.209
-38.98%
jan 1, 1973
2.373
-1.085
-31.39%
jan 1, 1974
1.541
-0.831
-35.04%
jan 1, 1975
1.663
+0.122
7.93%
jan 1, 1976
1.301
-0.363
-21.82%
jan 1, 1977
1.077
-0.223
-17.15%
jan 1, 1978
1.108
+0.031
2.84%
jan 1, 1979
0.958
-0.15
-13.51%
jan 1, 1980
0.946
-0.012
-1.29%
jan 1, 1981
1.131
+0.185
19.52%
jan 1, 1982
0.948
-0.183
-16.19%
jan 1, 1983
0.97
+0.022
2.37%
jan 1, 1984
1.046
+0.076
7.87%
jan 1, 1985
0.737
-0.309
-29.55%
jan 1, 1986
0.684
-0.053
-7.22%
jan 1, 1987
0.659
-0.025
-3.6%
jan 1, 1988
0.735
+0.076
11.48%
jan 1, 1989
0.866
+0.131
17.78%
jan 1, 1990
1.064
+0.198
22.89%
jan 1, 1991
0.839
-0.225
-21.16%
jan 1, 1992
0.712
-0.126
-15.06%
jan 1, 1993
0.837
+0.124
17.47%
jan 1, 1994
0.771
-0.066
-7.92%
jan 1, 1995
0.967
+0.196
25.47%
jan 1, 1996
1.037
+0.07
7.22%
jan 1, 1997
0.948
-0.089
-8.6%
jan 1, 1998
1.423
+0.476
50.21%
jan 1, 1999
1.769
+0.346
24.3%
jan 1, 2000
1.391
-0.378
-21.37%
jan 1, 2001
1.256
-0.135
-9.72%
jan 1, 2002
1.274
+0.018
1.46%
jan 1, 2003
1.354
+0.08
6.3%
jan 1, 2004
1.478
+0.123
9.1%
jan 1, 2005
1.683
+0.205
13.88%
jan 1, 2006
1.708
+0.026
1.52%
jan 1, 2007
2.5
+0.791
46.31%
jan 1, 2008
2.501
+0.002
0.07%
jan 1, 2009
2.233
-0.268
-10.72%
jan 1, 2010
1.935
-0.298
-13.36%
jan 1, 2011
2.091
+0.156
8.07%
jan 1, 2012
2.302
+0.211
10.07%
jan 1, 2013
2.144
-0.157
-6.84%
jan 1, 2014
2.025
-0.119
-5.55%
jan 1, 2015
2.043
+0.018
0.89%
jan 1, 2016
2.043
0.0
0.0%
Ranking of countries by current statistics by years


Comments: