29
/
en
AIzaSyAYiBZKx7MnpbEhh9jyipgxe19OcubqV5w
April 1, 2024
114022
Cote d'Ivoire
CIV
true
2
1
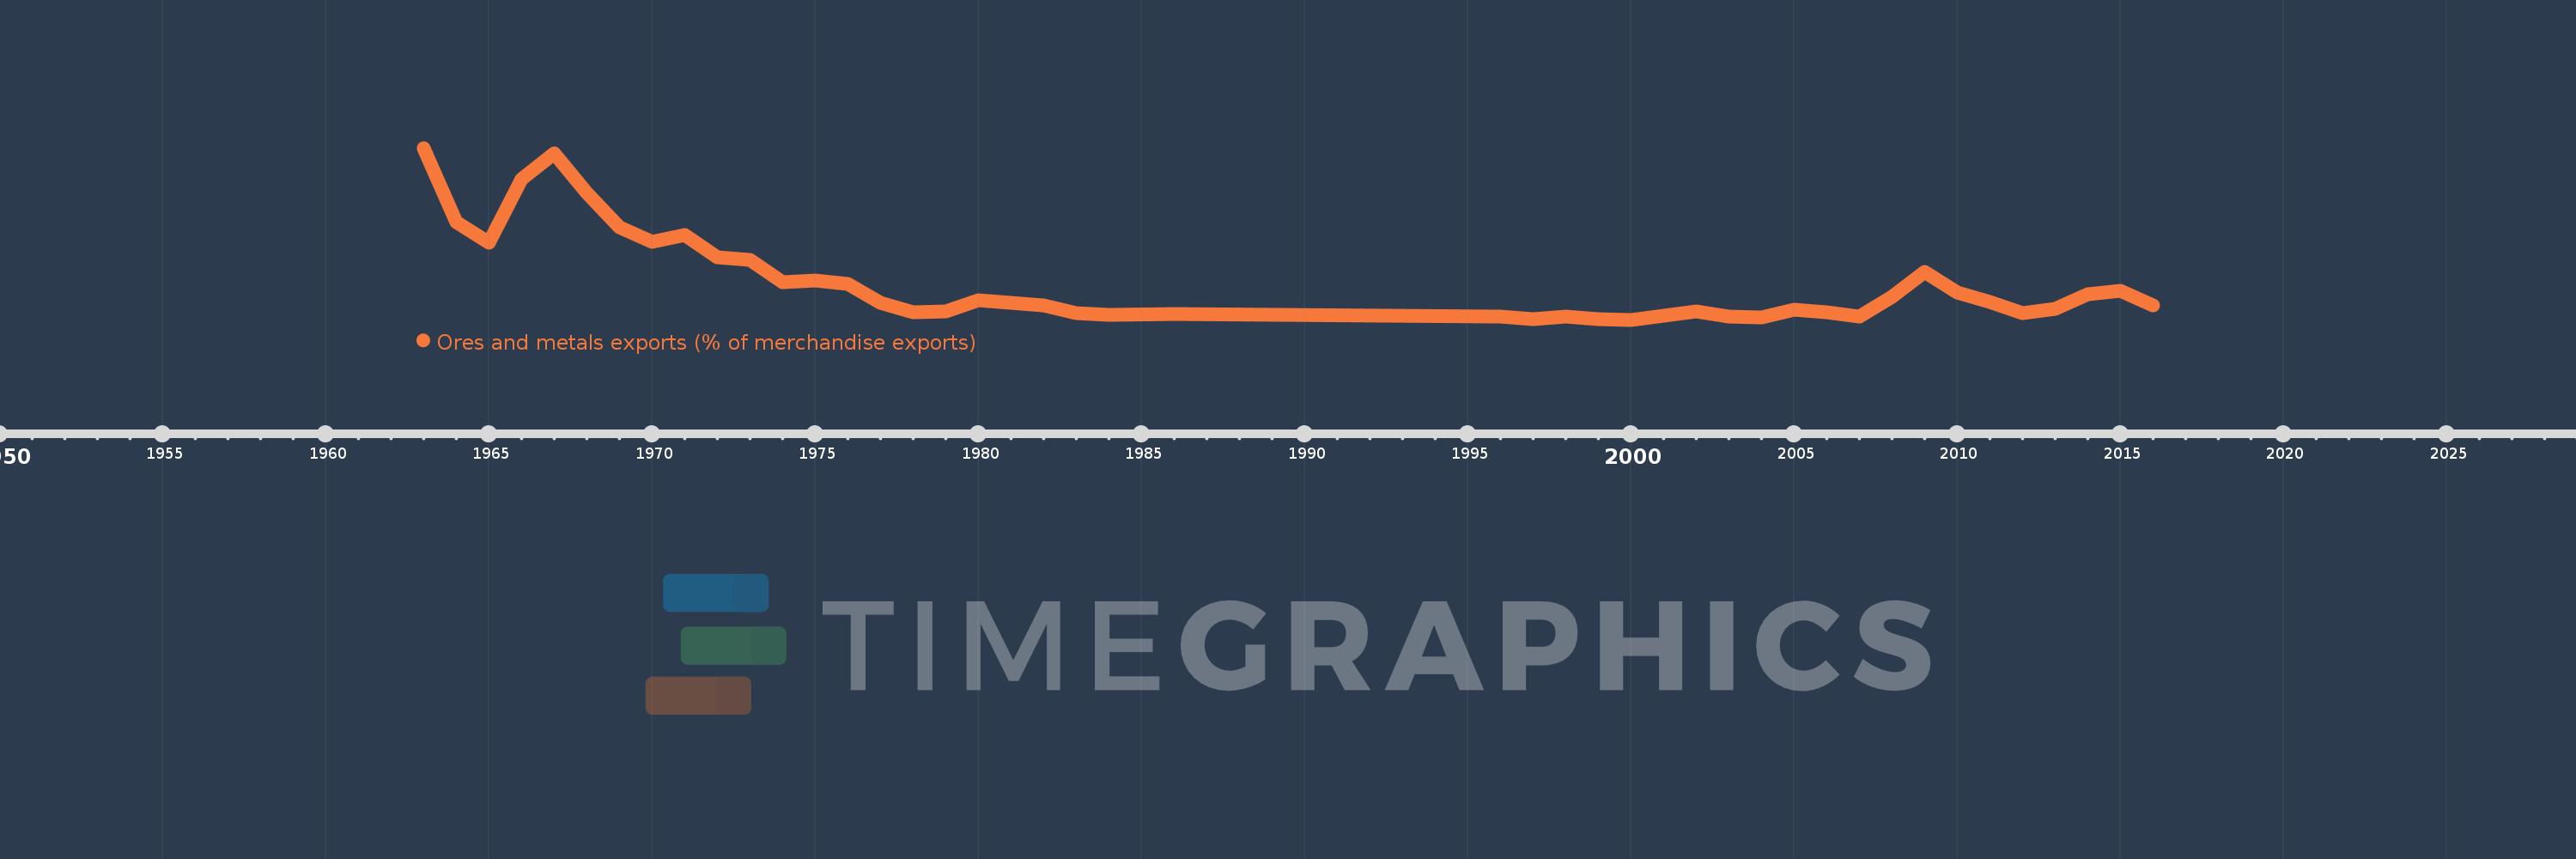
Ores and metals exports (% of merchandise exports)
2016,2015,2014,2013,2012,2011,2010,2009,2008,2007,2006,2005,2004,2003,2002,2001,2000,1999,1998,1997,1996,1986,1984,1983,1982,1980,1979,1978,1977,1976,1975,1974,1973,1972,1971,1970,1969,1968,1967,1966,1965,1964,1963
This statistics in other country:
AfghanistanAlbaniaAlgeriaAndorraAngolaAntigua and BarbudaArab WorldArgentinaArmeniaArubaAustraliaAustriaAzerbaijanBahamas, TheBahrainBangladeshBarbadosBelarusBelgiumBelizeBeninBermudaBhutanBoliviaBosnia and HerzegovinaBotswanaBrazilBrunei DarussalamBulgariaBurkina FasoBurundiCabo VerdeCambodiaCameroonCanadaCaribbean small statesCayman IslandsCentral African RepublicCentral Europe and the BalticsChadChileChinaColombiaComorosCongo, Dem. Rep.Congo, Rep.Costa RicaCote d'IvoireCroatiaCubaCyprusCzech RepublicDenmarkDjiboutiDominicaDominican RepublicEarly-demographic dividendEast Asia & PacificEast Asia & Pacific (excluding high income)East Asia & Pacific (IDA & IBRD countries)EcuadorEgypt, Arab Rep.El SalvadorEquatorial GuineaEritreaEstoniaEthiopiaEuro areaEurope & Central AsiaEurope & Central Asia (excluding high income)Europe & Central Asia (IDA & IBRD countries)European UnionFaroe IslandsFijiFinlandFragile and conflict affected situationsFranceFrench PolynesiaGabonGambia, TheGeorgiaGermanyGhanaGreeceGreenlandGrenadaGuatemalaGuineaGuinea-BissauGuyanaHaitiHeavily indebted poor countries (HIPC)High incomeHondurasHong Kong SAR, ChinaHungaryIBRD onlyIcelandIDA & IBRD totalIDA blendIDA onlyIDA totalIndiaIndonesiaIran, Islamic Rep.IraqIrelandIsraelItalyJamaicaJapanJordanKazakhstanKenyaKiribatiKorea, Rep.KuwaitKyrgyz RepublicLao PDRLate-demographic dividendLatin America & Caribbean Latin America & Caribbean (excluding high income)Latin America & the Caribbean (IDA & IBRD countries)LatviaLeast developed countries: UN classificationLebanonLesothoLiberiaLibyaLithuaniaLow & middle incomeLower middle incomeLuxembourgMacao SAR, ChinaMacedonia, FYRMadagascarMalawiMalaysiaMaldivesMaliMaltaMauritaniaMauritiusMexicoMiddle East & North AfricaMiddle East & North Africa (excluding high income)Middle East & North Africa (IDA & IBRD countries)Middle incomeMoldovaMongoliaMoroccoMozambiqueMyanmarNamibiaNepalNetherlandsNew CaledoniaNew ZealandNicaraguaNigerNigeriaNorth AmericaNorwayOECD membersOmanOther small statesPacific island small statesPakistanPalauPanamaPapua New GuineaParaguayPeruPhilippinesPolandPortugalPost-demographic dividendPre-demographic dividendQatarRomaniaRussian FederationRwandaSamoaSao Tome and PrincipeSaudi ArabiaSenegalSerbiaSeychellesSierra LeoneSingaporeSlovak RepublicSloveniaSmall statesSolomon IslandsSomaliaSouth AfricaSouth AsiaSouth Asia (IDA & IBRD)SpainSri LankaSt. Kitts and NevisSt. LuciaSt. Vincent and the GrenadinesSub-Saharan Africa Sub-Saharan Africa (excluding high income)Sub-Saharan Africa (IDA & IBRD countries)SudanSurinameSwazilandSwedenSwitzerlandSyrian Arab RepublicTajikistanTanzaniaThailandTimor-LesteTogoTongaTrinidad and TobagoTunisiaTurkeyTurkmenistanTurks and Caicos IslandsUgandaUkraineUnited Arab EmiratesUnited KingdomUnited StatesUpper middle incomeUruguayVanuatuVenezuela, RBVietnamVirgin Islands (U.S.)WorldYemen, Rep.ZambiaZimbabwe Timeline:
This timeline shows a graph from 1963 to 2016 of Cote d'Ivoire. No data until 1962. Number of actual observations by date: 43.
Source name:
World Development Indicators
Source organization:
World Bank staff estimates from the Comtrade database maintained by the United Nations Statistics Division.
Categories, topics:
Energy & Mining, Private Sector, Trade
Last updated:
apr 23, 2017
Indicators value changes by year
At the date of observation
Value
Absolute change
Change from previous value
jan 1, 1963
1.993
+1.993
0.0%
jan 1, 1964
1.187
-0.806
-40.44%
jan 1, 1965
0.961
-0.226
-19.05%
jan 1, 1966
1.654
+0.694
72.18%
jan 1, 1967
1.933
+0.278
16.83%
jan 1, 1968
1.504
-0.429
-22.19%
jan 1, 1969
1.135
-0.369
-24.54%
jan 1, 1970
0.977
-0.158
-13.9%
jan 1, 1971
1.053
+0.075
7.72%
jan 1, 1972
0.809
-0.244
-23.19%
jan 1, 1973
0.781
-0.027
-3.35%
jan 1, 1974
0.537
-0.245
-31.29%
jan 1, 1975
0.557
+0.02
3.79%
jan 1, 1976
0.518
-0.039
-7.0%
jan 1, 1977
0.314
-0.205
-39.49%
jan 1, 1978
0.206
-0.107
-34.23%
jan 1, 1979
0.216
+0.01
4.94%
jan 1, 1980
0.344
+0.127
58.89%
jan 1, 1982
0.281
-0.063
-18.21%
jan 1, 1983
0.199
-0.083
-29.36%
jan 1, 1984
0.186
-0.013
-6.32%
jan 1, 1986
0.194
+0.008
4.35%
jan 1, 1996
0.159
-0.035
-17.94%
jan 1, 1997
0.131
-0.029
-17.93%
jan 1, 1998
0.16
+0.029
22.09%
jan 1, 1999
0.131
-0.029
-17.97%
jan 1, 2000
0.129
-0.002
-1.54%
jan 1, 2001
0.17
+0.041
32.02%
jan 1, 2002
0.216
+0.045
26.69%
jan 1, 2003
0.164
-0.051
-23.77%
jan 1, 2004
0.158
-0.007
-4.07%
jan 1, 2005
0.234
+0.076
48.19%
jan 1, 2006
0.213
-0.021
-8.88%
jan 1, 2007
0.161
-0.052
-24.53%
jan 1, 2008
0.382
+0.221
137.29%
jan 1, 2009
0.645
+0.264
69.07%
jan 1, 2010
0.422
-0.223
-34.54%
jan 1, 2011
0.319
-0.103
-24.49%
jan 1, 2012
0.2
-0.119
-37.43%
jan 1, 2013
0.25
+0.051
25.54%
jan 1, 2014
0.407
+0.156
62.38%
jan 1, 2015
0.447
+0.04
9.94%
jan 1, 2016
0.283
-0.164
-36.63%
Ranking of countries by current statistics by years


Comments: