29
/
en
AIzaSyAYiBZKx7MnpbEhh9jyipgxe19OcubqV5w
April 1, 2024
107703
Colombia
COL
true
2
1
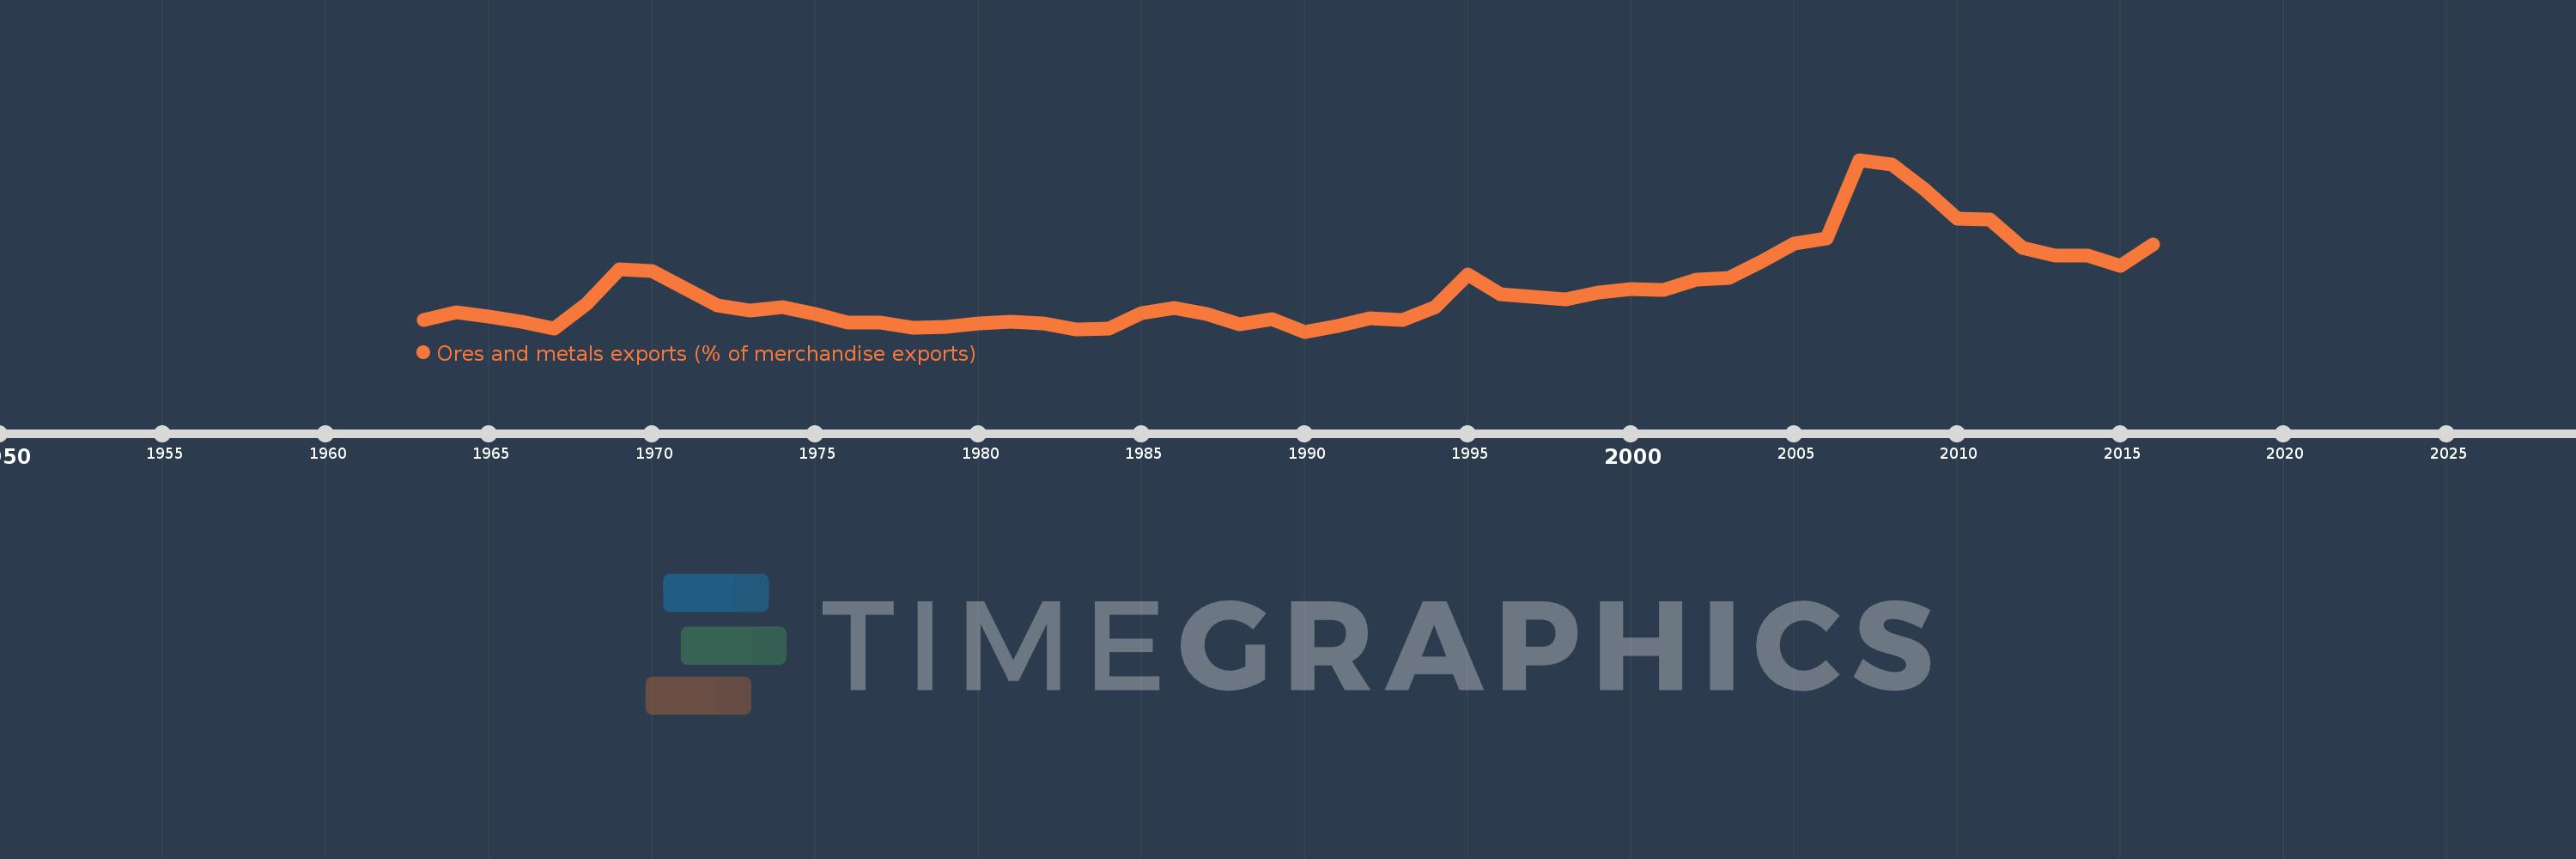
Ores and metals exports (% of merchandise exports)
2016,2015,2014,2013,2012,2011,2010,2009,2008,2007,2006,2005,2004,2003,2002,2001,2000,1999,1998,1997,1996,1995,1994,1993,1992,1991,1990,1989,1988,1987,1986,1985,1984,1983,1982,1981,1980,1979,1978,1977,1976,1975,1974,1973,1972,1971,1970,1969,1968,1967,1966,1965,1964,1963
This statistics in other country:
AfghanistanAlbaniaAlgeriaAndorraAngolaAntigua and BarbudaArab WorldArgentinaArmeniaArubaAustraliaAustriaAzerbaijanBahamas, TheBahrainBangladeshBarbadosBelarusBelgiumBelizeBeninBermudaBhutanBoliviaBosnia and HerzegovinaBotswanaBrazilBrunei DarussalamBulgariaBurkina FasoBurundiCabo VerdeCambodiaCameroonCanadaCaribbean small statesCayman IslandsCentral African RepublicCentral Europe and the BalticsChadChileChinaColombiaComorosCongo, Dem. Rep.Congo, Rep.Costa RicaCote d'IvoireCroatiaCubaCyprusCzech RepublicDenmarkDjiboutiDominicaDominican RepublicEarly-demographic dividendEast Asia & PacificEast Asia & Pacific (excluding high income)East Asia & Pacific (IDA & IBRD countries)EcuadorEgypt, Arab Rep.El SalvadorEquatorial GuineaEritreaEstoniaEthiopiaEuro areaEurope & Central AsiaEurope & Central Asia (excluding high income)Europe & Central Asia (IDA & IBRD countries)European UnionFaroe IslandsFijiFinlandFragile and conflict affected situationsFranceFrench PolynesiaGabonGambia, TheGeorgiaGermanyGhanaGreeceGreenlandGrenadaGuatemalaGuineaGuinea-BissauGuyanaHaitiHeavily indebted poor countries (HIPC)High incomeHondurasHong Kong SAR, ChinaHungaryIBRD onlyIcelandIDA & IBRD totalIDA blendIDA onlyIDA totalIndiaIndonesiaIran, Islamic Rep.IraqIrelandIsraelItalyJamaicaJapanJordanKazakhstanKenyaKiribatiKorea, Rep.KuwaitKyrgyz RepublicLao PDRLate-demographic dividendLatin America & Caribbean Latin America & Caribbean (excluding high income)Latin America & the Caribbean (IDA & IBRD countries)LatviaLeast developed countries: UN classificationLebanonLesothoLiberiaLibyaLithuaniaLow & middle incomeLower middle incomeLuxembourgMacao SAR, ChinaMacedonia, FYRMadagascarMalawiMalaysiaMaldivesMaliMaltaMauritaniaMauritiusMexicoMiddle East & North AfricaMiddle East & North Africa (excluding high income)Middle East & North Africa (IDA & IBRD countries)Middle incomeMoldovaMongoliaMoroccoMozambiqueMyanmarNamibiaNepalNetherlandsNew CaledoniaNew ZealandNicaraguaNigerNigeriaNorth AmericaNorwayOECD membersOmanOther small statesPacific island small statesPakistanPalauPanamaPapua New GuineaParaguayPeruPhilippinesPolandPortugalPost-demographic dividendPre-demographic dividendQatarRomaniaRussian FederationRwandaSamoaSao Tome and PrincipeSaudi ArabiaSenegalSerbiaSeychellesSierra LeoneSingaporeSlovak RepublicSloveniaSmall statesSolomon IslandsSomaliaSouth AfricaSouth AsiaSouth Asia (IDA & IBRD)SpainSri LankaSt. Kitts and NevisSt. LuciaSt. Vincent and the GrenadinesSub-Saharan Africa Sub-Saharan Africa (excluding high income)Sub-Saharan Africa (IDA & IBRD countries)SudanSurinameSwazilandSwedenSwitzerlandSyrian Arab RepublicTajikistanTanzaniaThailandTimor-LesteTogoTongaTrinidad and TobagoTunisiaTurkeyTurkmenistanTurks and Caicos IslandsUgandaUkraineUnited Arab EmiratesUnited KingdomUnited StatesUpper middle incomeUruguayVanuatuVenezuela, RBVietnamVirgin Islands (U.S.)WorldYemen, Rep.ZambiaZimbabwe Timeline:
This timeline shows a graph from 1963 to 2016 of Colombia. No data until 1962. Number of actual observations by date: 54.
Source name:
World Development Indicators
Source organization:
World Bank staff estimates from the Comtrade database maintained by the United Nations Statistics Division.
Categories, topics:
Energy & Mining, Private Sector, Trade
Last updated:
apr 23, 2017
Indicators value changes by year
At the date of observation
Value
Absolute change
Change from previous value
jan 1, 1963
0.258
+0.258
0.0%
jan 1, 1964
0.365
+0.107
41.32%
jan 1, 1965
0.302
-0.063
-17.23%
jan 1, 1966
0.23
-0.072
-23.89%
jan 1, 1967
0.14
-0.09
-39.25%
jan 1, 1968
0.479
+0.339
242.52%
jan 1, 1969
0.949
+0.47
98.26%
jan 1, 1970
0.936
-0.013
-1.34%
jan 1, 1971
0.689
-0.247
-26.4%
jan 1, 1972
0.461
-0.228
-33.06%
jan 1, 1973
0.379
-0.082
-17.74%
jan 1, 1974
0.428
+0.049
12.84%
jan 1, 1975
0.332
-0.096
-22.49%
jan 1, 1976
0.221
-0.111
-33.52%
jan 1, 1977
0.223
+0.002
0.88%
jan 1, 1978
0.145
-0.078
-34.89%
jan 1, 1979
0.163
+0.018
12.24%
jan 1, 1980
0.204
+0.042
25.72%
jan 1, 1981
0.235
+0.03
14.82%
jan 1, 1982
0.209
-0.026
-10.89%
jan 1, 1983
0.127
-0.083
-39.53%
jan 1, 1984
0.135
+0.009
6.86%
jan 1, 1985
0.354
+0.218
161.57%
jan 1, 1986
0.415
+0.061
17.33%
jan 1, 1987
0.334
-0.081
-19.59%
jan 1, 1988
0.191
-0.142
-42.62%
jan 1, 1989
0.268
+0.077
40.08%
jan 1, 1990
0.093
-0.175
-65.32%
jan 1, 1991
0.168
+0.075
80.54%
jan 1, 1992
0.278
+0.11
65.76%
jan 1, 1993
0.255
-0.023
-8.22%
jan 1, 1994
0.427
+0.171
66.98%
jan 1, 1995
0.886
+0.459
107.65%
jan 1, 1996
0.611
-0.274
-30.99%
jan 1, 1997
0.569
-0.042
-6.87%
jan 1, 1998
0.537
-0.033
-5.74%
jan 1, 1999
0.633
+0.097
18.05%
jan 1, 2000
0.68
+0.047
7.4%
jan 1, 2001
0.664
-0.017
-2.43%
jan 1, 2002
0.811
+0.147
22.14%
jan 1, 2003
0.834
+0.023
2.81%
jan 1, 2004
1.061
+0.227
27.23%
jan 1, 2005
1.307
+0.246
23.24%
jan 1, 2006
1.381
+0.074
5.66%
jan 1, 2007
2.468
+1.087
78.74%
jan 1, 2008
2.405
-0.063
-2.56%
jan 1, 2009
2.054
-0.351
-14.6%
jan 1, 2010
1.653
-0.401
-19.5%
jan 1, 2011
1.644
-0.01
-0.59%
jan 1, 2012
1.246
-0.398
-24.22%
jan 1, 2013
1.149
-0.097
-7.78%
jan 1, 2014
1.14
-0.009
-0.77%
jan 1, 2015
0.997
-0.143
-12.51%
jan 1, 2016
1.304
+0.307
30.8%
Ranking of countries by current statistics by years


Comments: