29
/
en
AIzaSyAYiBZKx7MnpbEhh9jyipgxe19OcubqV5w
April 1, 2024
31001
Europe & Central Asia
ECS
false
2
1
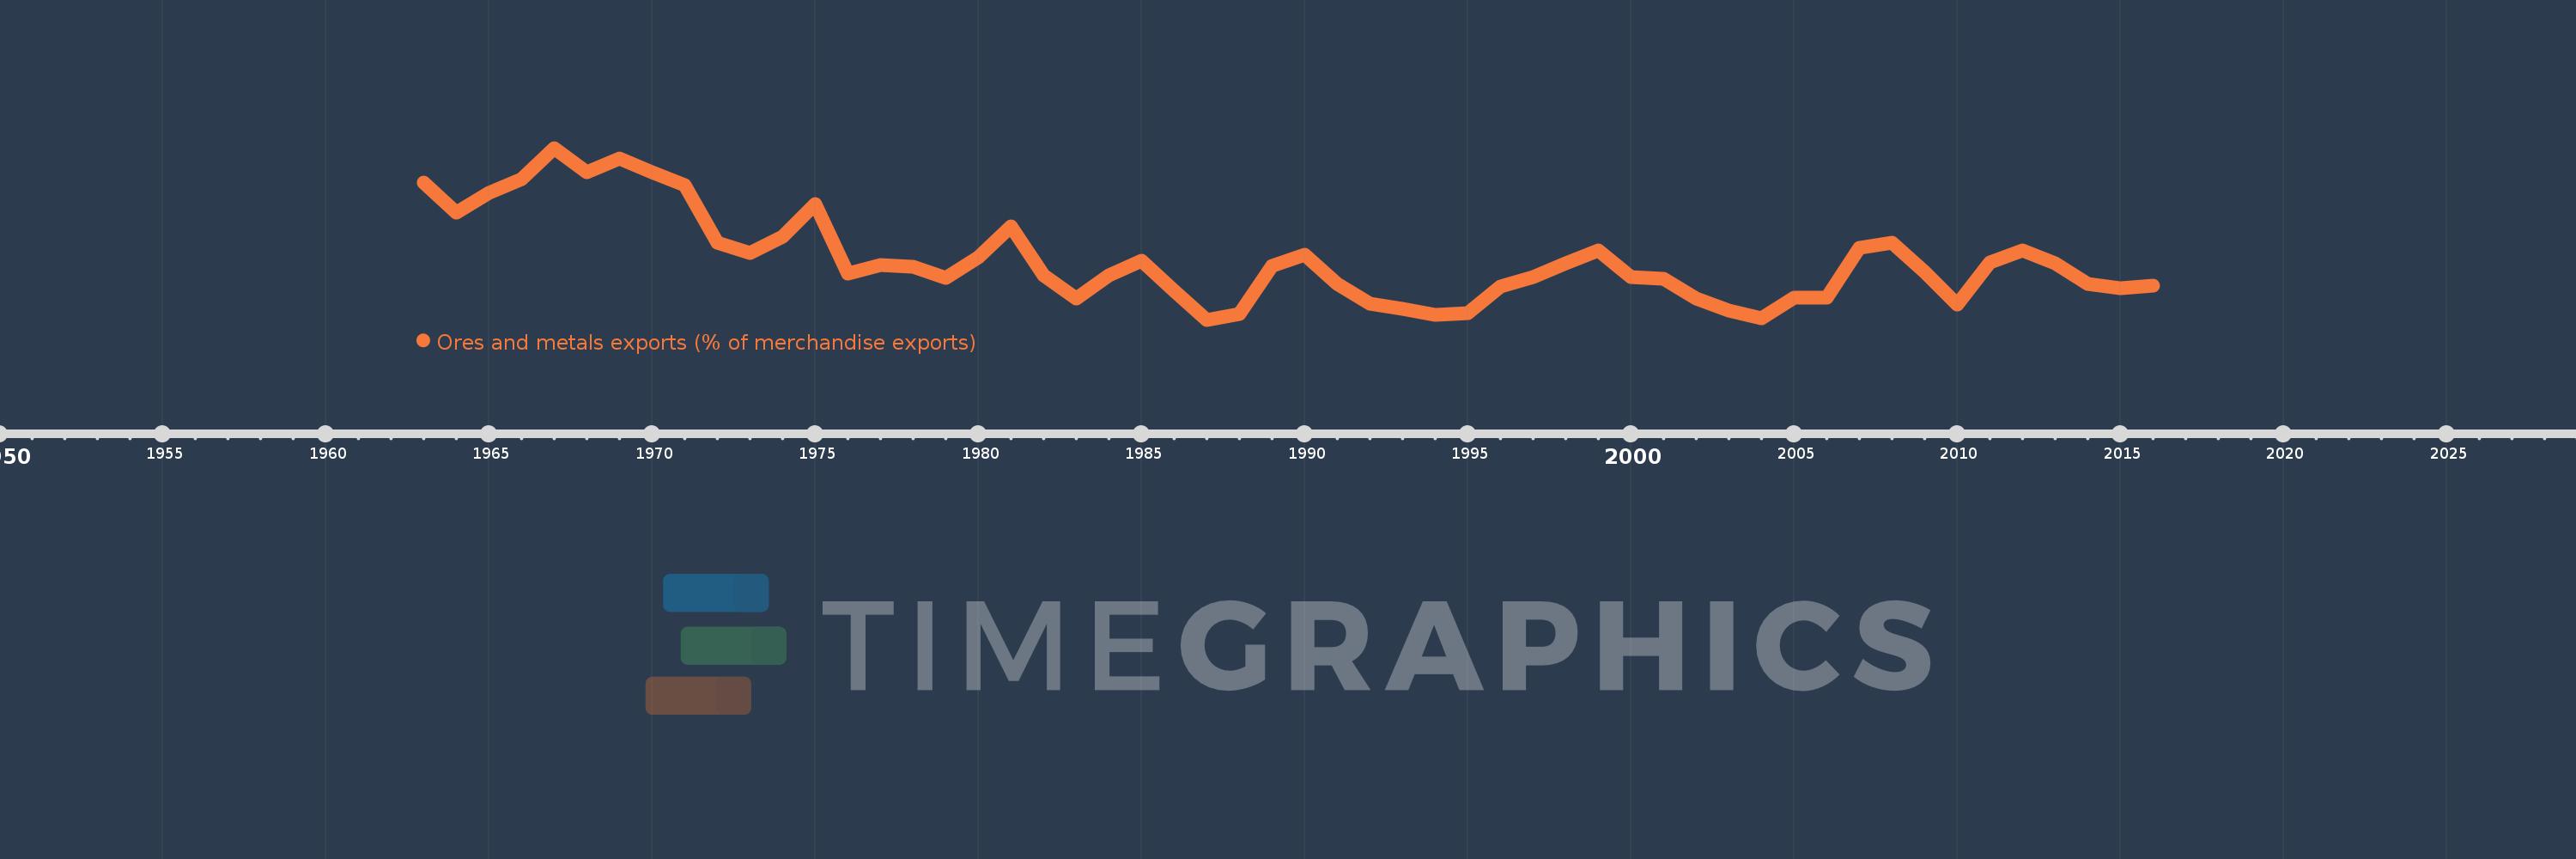
Ores and metals exports (% of merchandise exports)
2016,2015,2014,2013,2012,2011,2010,2009,2008,2007,2006,2005,2004,2003,2002,2001,2000,1999,1998,1997,1996,1995,1994,1993,1992,1991,1990,1989,1988,1987,1986,1985,1984,1983,1982,1981,1980,1979,1978,1977,1976,1975,1974,1973,1972,1971,1970,1969,1968,1967,1966,1965,1964,1963
This statistics in other country:
AfghanistanAlbaniaAlgeriaAndorraAngolaAntigua and BarbudaArab WorldArgentinaArmeniaArubaAustraliaAustriaAzerbaijanBahamas, TheBahrainBangladeshBarbadosBelarusBelgiumBelizeBeninBermudaBhutanBoliviaBosnia and HerzegovinaBotswanaBrazilBrunei DarussalamBulgariaBurkina FasoBurundiCabo VerdeCambodiaCameroonCanadaCaribbean small statesCayman IslandsCentral African RepublicCentral Europe and the BalticsChadChileChinaColombiaComorosCongo, Dem. Rep.Congo, Rep.Costa RicaCote d'IvoireCroatiaCubaCyprusCzech RepublicDenmarkDjiboutiDominicaDominican RepublicEarly-demographic dividendEast Asia & PacificEast Asia & Pacific (excluding high income)East Asia & Pacific (IDA & IBRD countries)EcuadorEgypt, Arab Rep.El SalvadorEquatorial GuineaEritreaEstoniaEthiopiaEuro areaEurope & Central AsiaEurope & Central Asia (excluding high income)Europe & Central Asia (IDA & IBRD countries)European UnionFaroe IslandsFijiFinlandFragile and conflict affected situationsFranceFrench PolynesiaGabonGambia, TheGeorgiaGermanyGhanaGreeceGreenlandGrenadaGuatemalaGuineaGuinea-BissauGuyanaHaitiHeavily indebted poor countries (HIPC)High incomeHondurasHong Kong SAR, ChinaHungaryIBRD onlyIcelandIDA & IBRD totalIDA blendIDA onlyIDA totalIndiaIndonesiaIran, Islamic Rep.IraqIrelandIsraelItalyJamaicaJapanJordanKazakhstanKenyaKiribatiKorea, Rep.KuwaitKyrgyz RepublicLao PDRLate-demographic dividendLatin America & Caribbean Latin America & Caribbean (excluding high income)Latin America & the Caribbean (IDA & IBRD countries)LatviaLeast developed countries: UN classificationLebanonLesothoLiberiaLibyaLithuaniaLow & middle incomeLower middle incomeLuxembourgMacao SAR, ChinaMacedonia, FYRMadagascarMalawiMalaysiaMaldivesMaliMaltaMauritaniaMauritiusMexicoMiddle East & North AfricaMiddle East & North Africa (excluding high income)Middle East & North Africa (IDA & IBRD countries)Middle incomeMoldovaMongoliaMoroccoMozambiqueMyanmarNamibiaNepalNetherlandsNew CaledoniaNew ZealandNicaraguaNigerNigeriaNorth AmericaNorwayOECD membersOmanOther small statesPacific island small statesPakistanPalauPanamaPapua New GuineaParaguayPeruPhilippinesPolandPortugalPost-demographic dividendPre-demographic dividendQatarRomaniaRussian FederationRwandaSamoaSao Tome and PrincipeSaudi ArabiaSenegalSerbiaSeychellesSierra LeoneSingaporeSlovak RepublicSloveniaSmall statesSolomon IslandsSomaliaSouth AfricaSouth AsiaSouth Asia (IDA & IBRD)SpainSri LankaSt. Kitts and NevisSt. LuciaSt. Vincent and the GrenadinesSub-Saharan Africa Sub-Saharan Africa (excluding high income)Sub-Saharan Africa (IDA & IBRD countries)SudanSurinameSwazilandSwedenSwitzerlandSyrian Arab RepublicTajikistanTanzaniaThailandTimor-LesteTogoTongaTrinidad and TobagoTunisiaTurkeyTurkmenistanTurks and Caicos IslandsUgandaUkraineUnited Arab EmiratesUnited KingdomUnited StatesUpper middle incomeUruguayVanuatuVenezuela, RBVietnamVirgin Islands (U.S.)WorldYemen, Rep.ZambiaZimbabwe Timeline:
This timeline shows a graph from 1963 to 2016 of Europe & Central Asia. No data until 1962. Number of actual observations by date: 54.
Source name:
World Development Indicators
Source organization:
World Bank staff estimates from the Comtrade database maintained by the United Nations Statistics Division.
Categories, topics:
Energy & Mining, Private Sector, Trade
Last updated:
apr 23, 2017
Indicators value changes by year
At the date of observation
Value
Absolute change
Change from previous value
jan 1, 1963
4.81
+4.81
0.0%
jan 1, 1964
4.343
-0.467
-9.71%
jan 1, 1965
4.65
+0.307
7.07%
jan 1, 1966
4.86
+0.211
4.53%
jan 1, 1967
5.351
+0.49
10.09%
jan 1, 1968
4.967
-0.384
-7.18%
jan 1, 1969
5.186
+0.22
4.42%
jan 1, 1970
4.972
-0.215
-4.14%
jan 1, 1971
4.776
-0.195
-3.93%
jan 1, 1972
3.872
-0.905
-18.94%
jan 1, 1973
3.719
-0.153
-3.95%
jan 1, 1974
3.969
+0.25
6.73%
jan 1, 1975
4.473
+0.504
12.71%
jan 1, 1976
3.393
-1.08
-24.14%
jan 1, 1977
3.527
+0.134
3.95%
jan 1, 1978
3.504
-0.023
-0.67%
jan 1, 1979
3.328
-0.176
-5.02%
jan 1, 1980
3.656
+0.328
9.87%
jan 1, 1981
4.135
+0.478
13.08%
jan 1, 1982
3.372
-0.763
-18.44%
jan 1, 1983
3.007
-0.365
-10.81%
jan 1, 1984
3.375
+0.368
12.24%
jan 1, 1985
3.598
+0.222
6.59%
jan 1, 1986
3.128
-0.469
-13.05%
jan 1, 1987
2.679
-0.449
-14.35%
jan 1, 1988
2.767
+0.088
3.28%
jan 1, 1989
3.522
+0.754
27.26%
jan 1, 1990
3.695
+0.173
4.91%
jan 1, 1991
3.235
-0.46
-12.44%
jan 1, 1992
2.935
-0.3
-9.26%
jan 1, 1993
2.854
-0.082
-2.79%
jan 1, 1994
2.749
-0.104
-3.65%
jan 1, 1995
2.781
+0.031
1.13%
jan 1, 1996
3.196
+0.415
14.93%
jan 1, 1997
3.34
+0.144
4.51%
jan 1, 1998
3.563
+0.223
6.69%
jan 1, 1999
3.758
+0.194
5.46%
jan 1, 2000
3.343
-0.414
-11.03%
jan 1, 2001
3.311
-0.033
-0.97%
jan 1, 2002
3.015
-0.296
-8.93%
jan 1, 2003
2.821
-0.194
-6.44%
jan 1, 2004
2.708
-0.113
-4.0%
jan 1, 2005
3.023
+0.315
11.62%
jan 1, 2006
3.026
+0.003
0.1%
jan 1, 2007
3.796
+0.77
25.44%
jan 1, 2008
3.883
+0.087
2.3%
jan 1, 2009
3.419
-0.464
-11.94%
jan 1, 2010
2.919
-0.5
-14.63%
jan 1, 2011
3.566
+0.647
22.17%
jan 1, 2012
3.763
+0.197
5.53%
jan 1, 2013
3.551
-0.212
-5.65%
jan 1, 2014
3.234
-0.316
-8.91%
jan 1, 2015
3.164
-0.071
-2.19%
jan 1, 2016
3.21
+0.047
1.48%
Ranking of countries by current statistics by years


Comments: