30
/
AIzaSyAYiBZKx7MnpbEhh9jyipgxe19OcubqV5w
April 1, 2024
227741
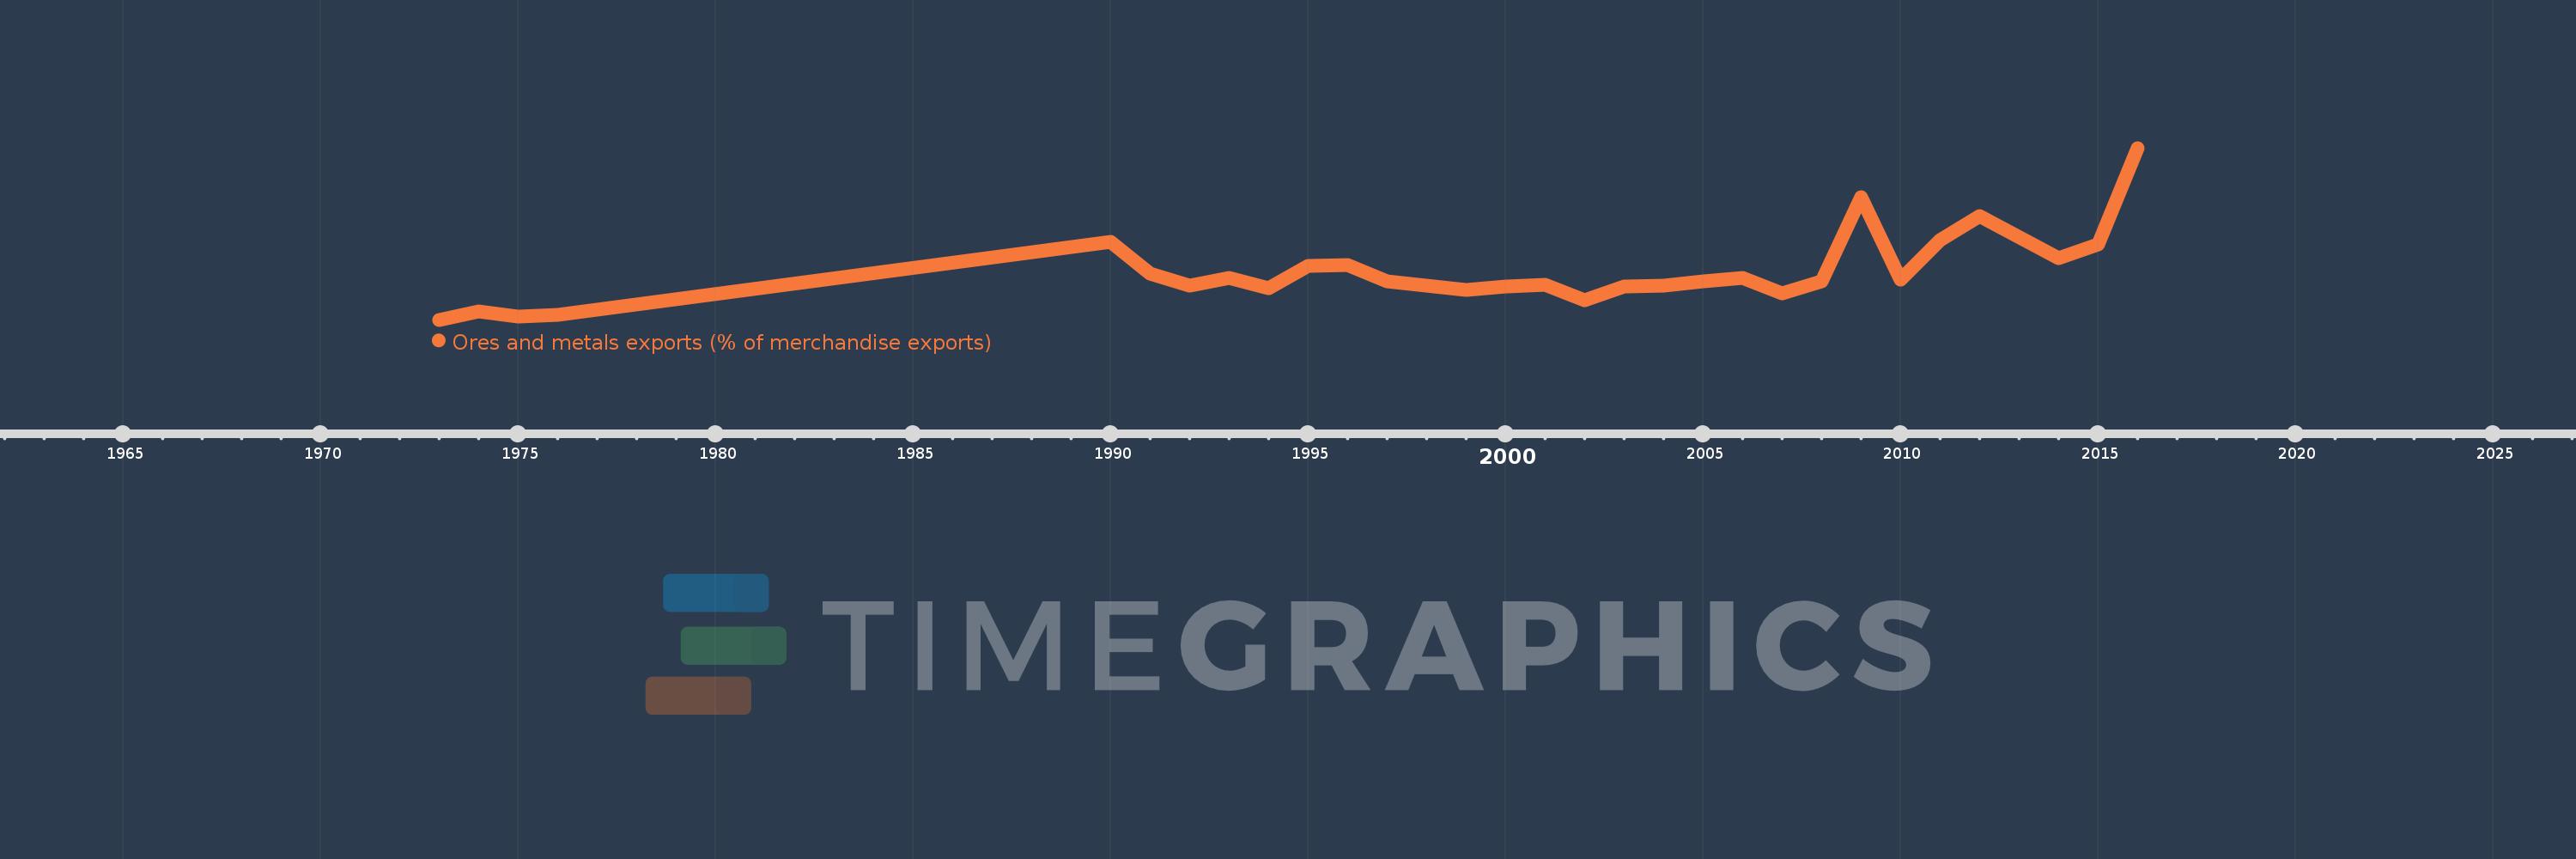
Qatar
QAT
true
2
1
Ores and metals exports (% of merchandise exports)
2016,2015,2014,2012,2011,2010,2009,2008,2007,2006,2005,2004,2003,2002,2001,2000,1999,1997,1996,1995,1994,1993,1992,1991,1990,1976,1975,1974,1973
