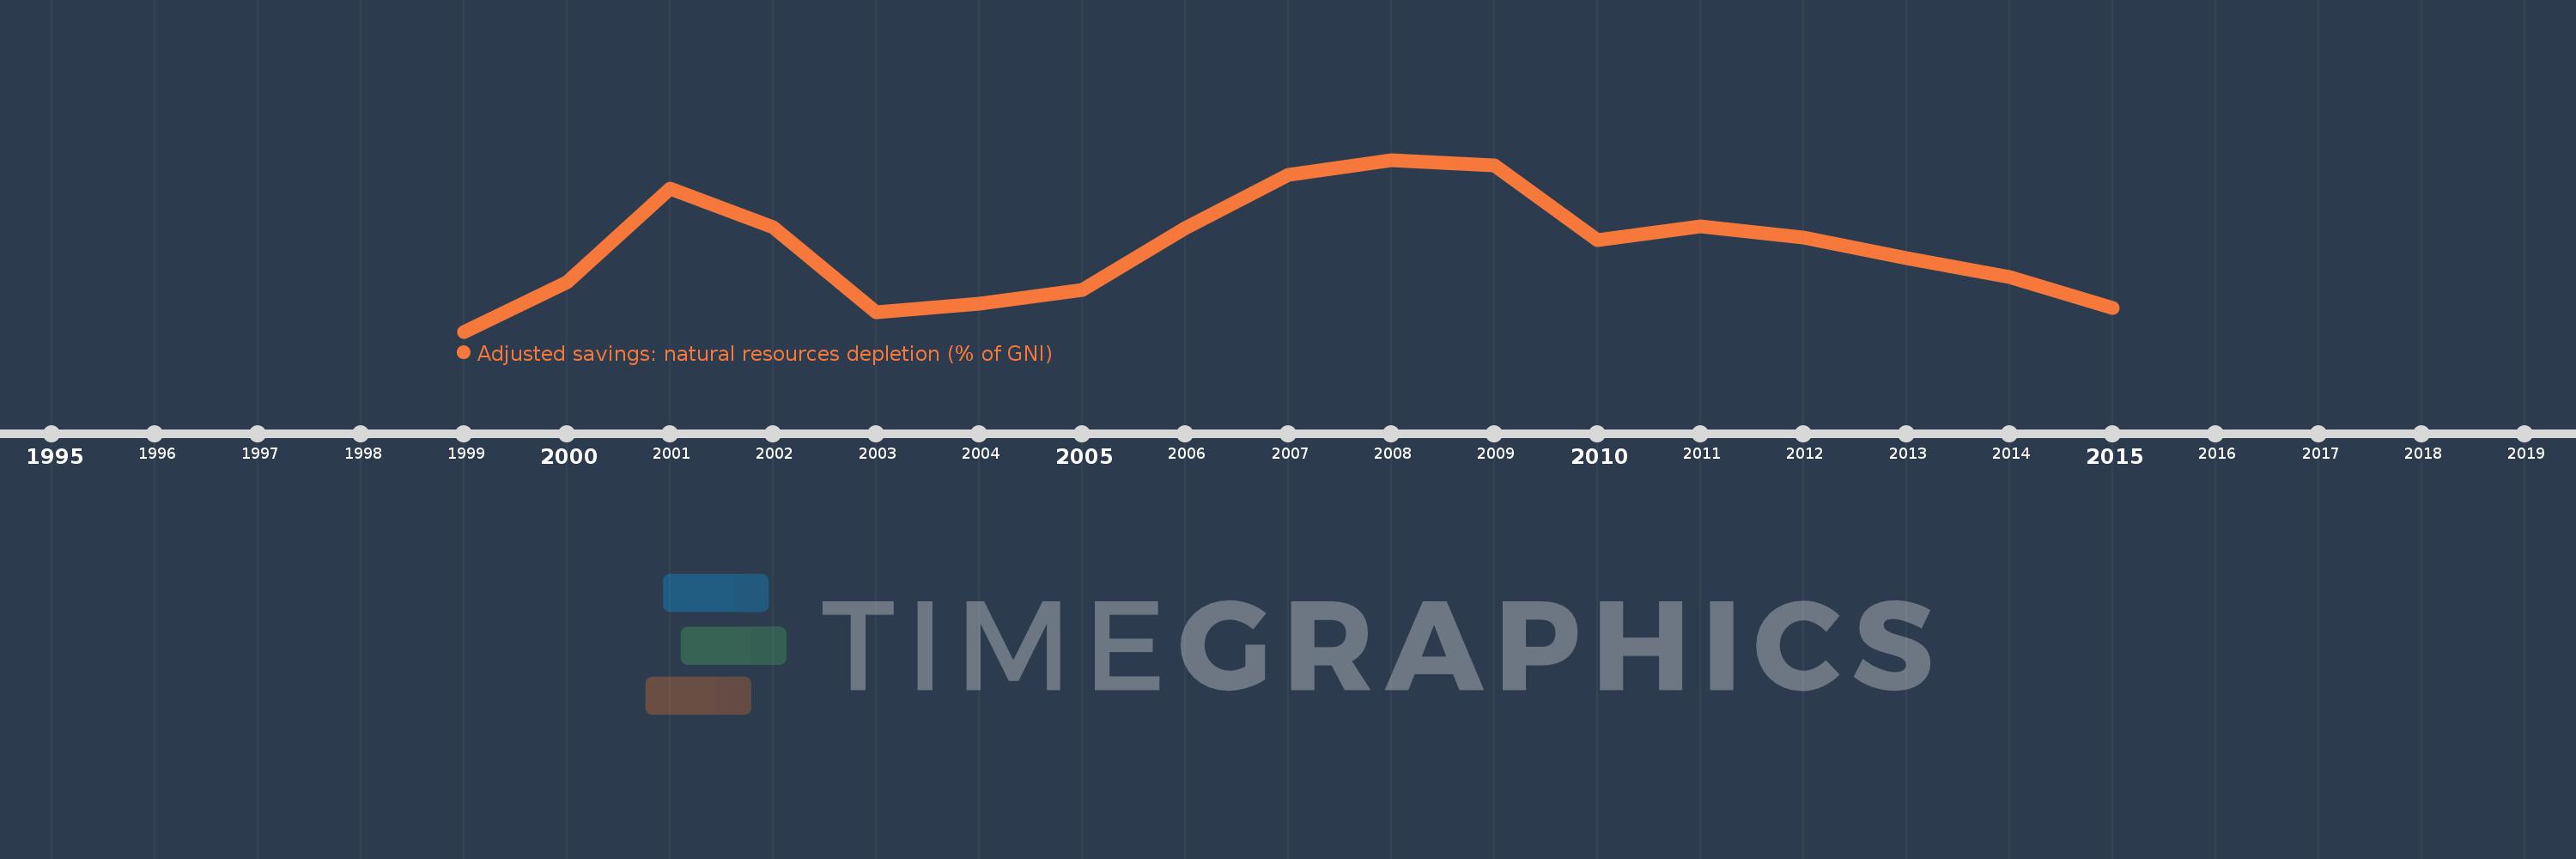
This timeline shows a graph from 1999 to 2015 of Azerbaijan. No data until 1998. Number of actual observations by date: 17.
Source name:
World Development Indicators
Source organization:
World Bank staff estimates based on sources and methods in World Bank's "The Changing Wealth of Nations: Measuring Sustainable Development in the New Millennium" (2011).
Categories, topics:
Economy & Growth, Energy & Mining
Last updated:
apr 23, 2017
Indicators value changes by year
Meaning:
31.526
Minimum:
14.906
jan 1, 1999
Maximum:
48.903
jan 1, 2008
At the date of observation
Value
Absolute change
Change from the previous value
jan 1, 1999
14.906
+14.906
0.0%
jan 1, 2000
24.762
+9.856
66.12%
jan 1, 2001
43.292
+18.53
74.84%
jan 1, 2002
35.566
-7.726
-17.85%
jan 1, 2003
18.774
-16.792
-47.21%
jan 1, 2004
20.453
+1.679
8.94%
jan 1, 2005
23.109
+2.657
12.99%
jan 1, 2006
35.435
+12.325
53.33%
jan 1, 2007
45.895
+10.461
29.52%
jan 1, 2008
48.903
+3.008
6.55%
jan 1, 2009
47.736
-1.167
-2.39%
jan 1, 2010
32.943
-14.794
-30.99%
jan 1, 2011
35.729
+2.787
8.46%
jan 1, 2012
33.591
-2.138
-5.98%
jan 1, 2013
29.446
-4.146
-12.34%
jan 1, 2014
25.762
-3.684
-12.51%
jan 1, 2015
19.64
-6.122
-23.76%
Ranking of countries by current statistics by years
