29
/
en
AIzaSyAYiBZKx7MnpbEhh9jyipgxe19OcubqV5w
April 1, 2024
50615
Middle income
MIC
false
2
1
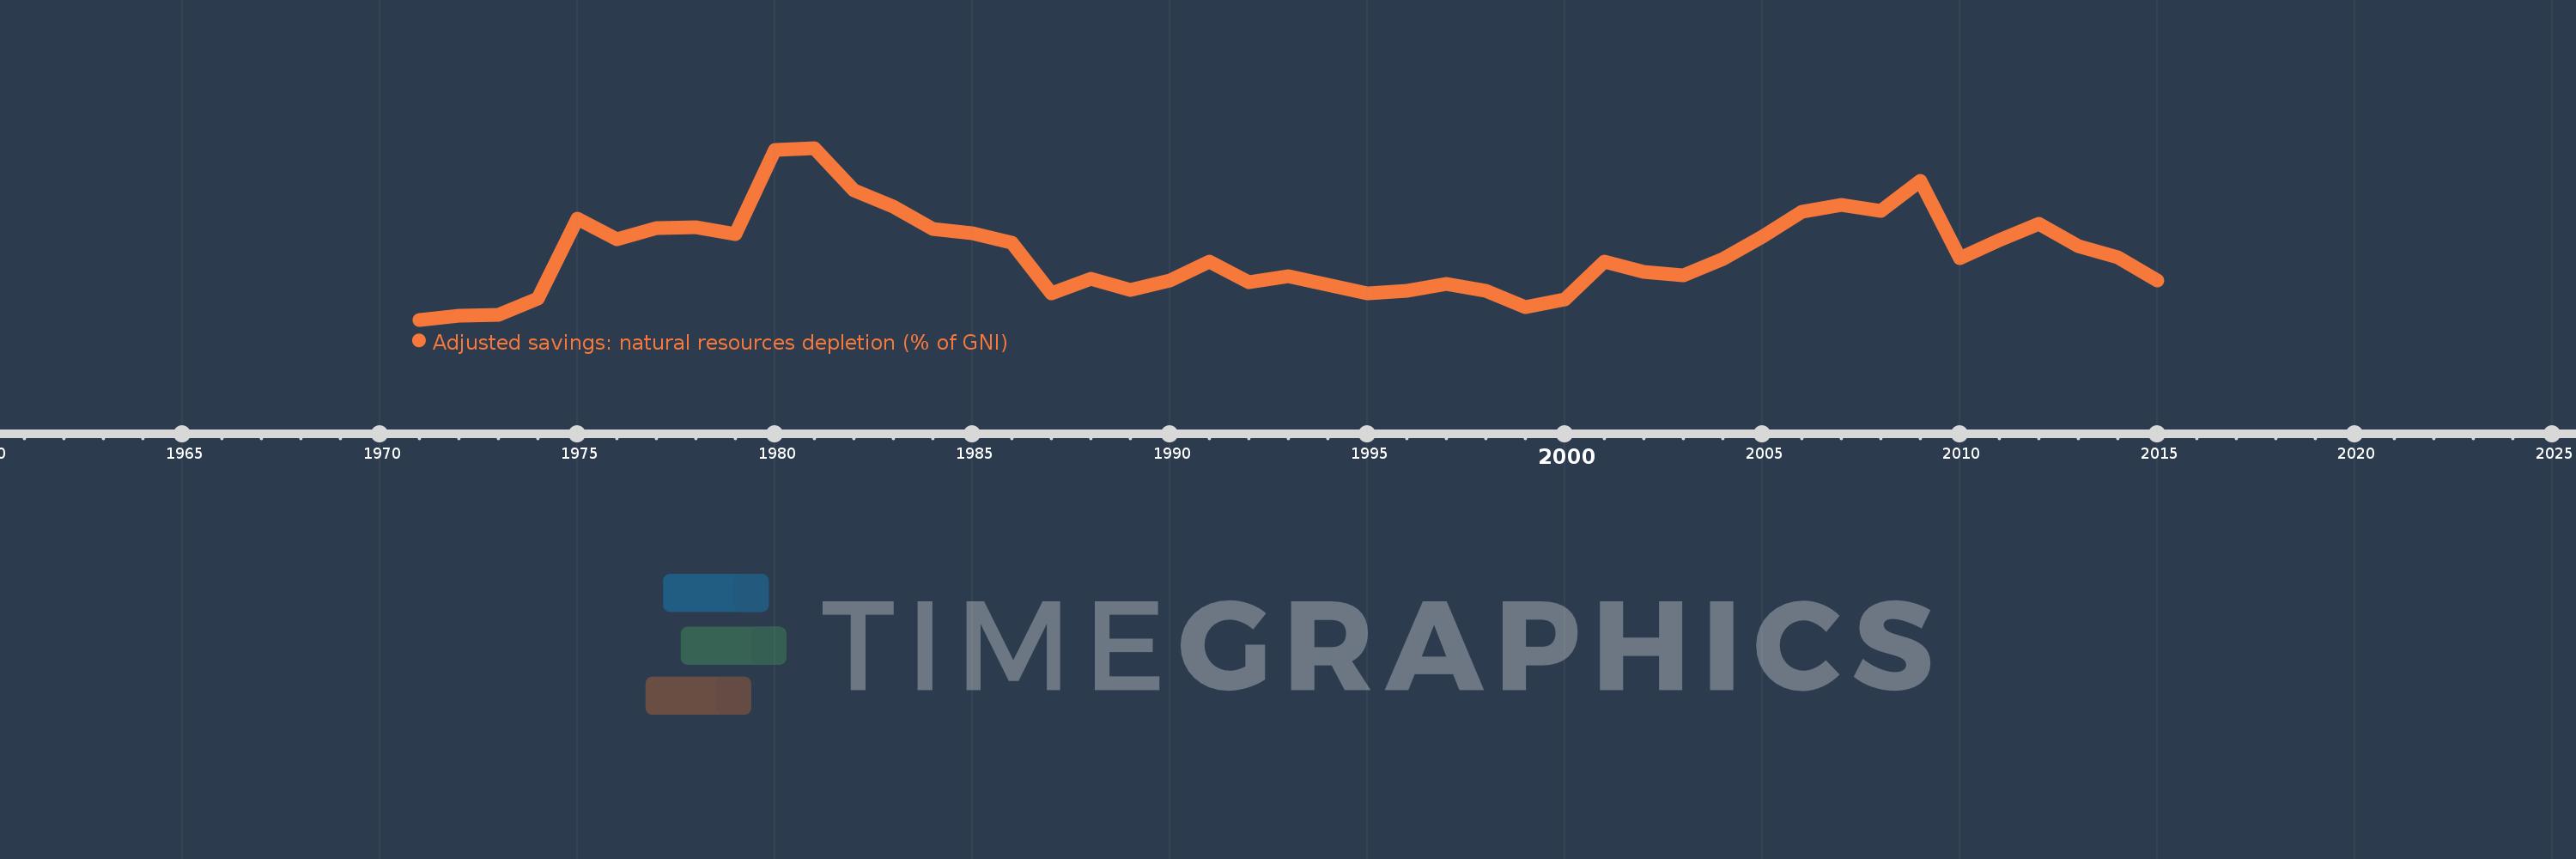
Adjusted savings: natural resources depletion (% of GNI)
2015,2014,2013,2012,2011,2010,2009,2008,2007,2006,2005,2004,2003,2002,2001,2000,1999,1998,1997,1996,1995,1994,1993,1992,1991,1990,1989,1988,1987,1986,1985,1984,1983,1982,1981,1980,1979,1978,1977,1976,1975,1974,1973,1972,1971
This statistics in other country:
AfghanistanAlbaniaAlgeriaAngolaArab WorldArgentinaArmeniaAustraliaAustriaAzerbaijanBahamas, TheBahrainBangladeshBarbadosBelarusBelgiumBelizeBeninBhutanBoliviaBotswanaBrazilBrunei DarussalamBulgariaBurkina FasoBurundiCabo VerdeCambodiaCameroonCanadaCaribbean small statesCentral African RepublicCentral Europe and the BalticsChadChileChinaColombiaComorosCongo, Dem. Rep.Congo, Rep.Costa RicaCote d'IvoireCroatiaCubaCyprusCzech RepublicDenmarkDjiboutiDominicaDominican RepublicEarly-demographic dividendEast Asia & PacificEast Asia & Pacific (excluding high income)East Asia & Pacific (IDA & IBRD countries)EcuadorEgypt, Arab Rep.El SalvadorEquatorial GuineaEritreaEstoniaEthiopiaEuro areaEurope & Central AsiaEurope & Central Asia (excluding high income)Europe & Central Asia (IDA & IBRD countries)European UnionFijiFinlandFragile and conflict affected situationsFranceFrench PolynesiaGabonGambia, TheGeorgiaGermanyGhanaGreeceGuatemalaGuineaGuinea-BissauGuyanaHaitiHeavily indebted poor countries (HIPC)High incomeHondurasHong Kong SAR, ChinaHungaryIBRD onlyIcelandIDA & IBRD totalIDA blendIDA onlyIDA totalIndiaIndonesiaIran, Islamic Rep.IraqIrelandIsraelItalyJamaicaJapanJordanKazakhstanKenyaKiribatiKorea, Rep.KuwaitKyrgyz RepublicLao PDRLate-demographic dividendLatin America & Caribbean Latin America & Caribbean (excluding high income)Latin America & the Caribbean (IDA & IBRD countries)LatviaLeast developed countries: UN classificationLebanonLesothoLiberiaLibyaLithuaniaLow & middle incomeLow incomeLower middle incomeLuxembourgMacedonia, FYRMadagascarMalawiMalaysiaMaldivesMaliMauritaniaMauritiusMexicoMicronesia, Fed. Sts.Middle East & North AfricaMiddle East & North Africa (excluding high income)Middle East & North Africa (IDA & IBRD countries)Middle incomeMoldovaMongoliaMoroccoMozambiqueMyanmarNamibiaNepalNetherlandsNew CaledoniaNew ZealandNicaraguaNigerNigeriaNorth AmericaNorwayOECD membersOmanOther small statesPacific island small statesPakistanPanamaPapua New GuineaParaguayPeruPhilippinesPolandPortugalPost-demographic dividendPre-demographic dividendQatarRomaniaRussian FederationRwandaSamoaSao Tome and PrincipeSaudi ArabiaSenegalSeychellesSierra LeoneSingaporeSlovak RepublicSloveniaSmall statesSolomon IslandsSomaliaSouth AfricaSouth AsiaSouth Asia (IDA & IBRD)SpainSri LankaSt. LuciaSt. Vincent and the GrenadinesSub-Saharan Africa Sub-Saharan Africa (excluding high income)Sub-Saharan Africa (IDA & IBRD countries)SudanSurinameSwazilandSwedenSwitzerlandSyrian Arab RepublicTajikistanTanzaniaThailandTogoTongaTrinidad and TobagoTunisiaTurkeyTurkmenistanUgandaUkraineUnited Arab EmiratesUnited KingdomUnited StatesUpper middle incomeUruguayUzbekistanVanuatuVenezuela, RBVietnamWorldYemen, Rep.ZambiaZimbabwe Timeline:
This timeline shows a graph from 1971 to 2015 of Middle income. No data until 1970. Number of actual observations by date: 45.
Source name:
World Development Indicators
Source organization:
World Bank staff estimates based on sources and methods in World Bank's "The Changing Wealth of Nations: Measuring Sustainable Development in the New Millennium" (2011).
Categories, topics:
Economy & Growth, Energy & Mining
Last updated:
apr 23, 2017
Indicators value changes by year
Maximum:
11.123
jan 1, 1981
At the date of observation
Value
Absolute change
Change from previous value
jan 1, 1971
1.642
+1.642
0.0%
jan 1, 1972
1.859
+0.217
13.2%
jan 1, 1973
1.891
+0.032
1.73%
jan 1, 1974
2.808
+0.917
48.48%
jan 1, 1975
7.226
+4.418
157.3%
jan 1, 1976
6.103
-1.123
-15.54%
jan 1, 1977
6.714
+0.611
10.01%
jan 1, 1978
6.764
+0.05
0.75%
jan 1, 1979
6.36
-0.404
-5.97%
jan 1, 1980
11.007
+4.646
73.05%
jan 1, 1981
11.123
+0.117
1.06%
jan 1, 1982
8.772
-2.352
-21.14%
jan 1, 1983
7.883
-0.889
-10.13%
jan 1, 1984
6.658
-1.225
-15.54%
jan 1, 1985
6.438
-0.221
-3.31%
jan 1, 1986
5.897
-0.541
-8.4%
jan 1, 1987
3.084
-2.813
-47.71%
jan 1, 1988
3.88
+0.796
25.82%
jan 1, 1989
3.278
-0.602
-15.51%
jan 1, 1990
3.806
+0.528
16.09%
jan 1, 1991
4.85
+1.045
27.45%
jan 1, 1992
3.731
-1.119
-23.07%
jan 1, 1993
4.026
+0.294
7.89%
jan 1, 1994
3.584
-0.442
-10.98%
jan 1, 1995
3.105
-0.478
-13.35%
jan 1, 1996
3.245
+0.14
4.5%
jan 1, 1997
3.635
+0.39
12.03%
jan 1, 1998
3.244
-0.391
-10.76%
jan 1, 1999
2.327
-0.917
-28.28%
jan 1, 2000
2.762
+0.435
18.69%
jan 1, 2001
4.856
+2.094
75.82%
jan 1, 2002
4.264
-0.592
-12.19%
jan 1, 2003
4.112
-0.152
-3.56%
jan 1, 2004
4.99
+0.879
21.37%
jan 1, 2005
6.227
+1.236
24.78%
jan 1, 2006
7.611
+1.384
22.23%
jan 1, 2007
7.969
+0.357
4.7%
jan 1, 2008
7.634
-0.335
-4.21%
jan 1, 2009
9.288
+1.655
21.68%
jan 1, 2010
5.027
-4.261
-45.88%
jan 1, 2011
6.02
+0.993
19.76%
jan 1, 2012
6.933
+0.912
15.15%
jan 1, 2013
5.698
-1.235
-17.81%
jan 1, 2014
5.067
-0.631
-11.07%
jan 1, 2015
3.822
-1.245
-24.58%
Ranking of countries by current statistics by years


Comments: