29
/
en
AIzaSyAYiBZKx7MnpbEhh9jyipgxe19OcubqV5w
April 1, 2024
62350
World
WLD
false
2
1
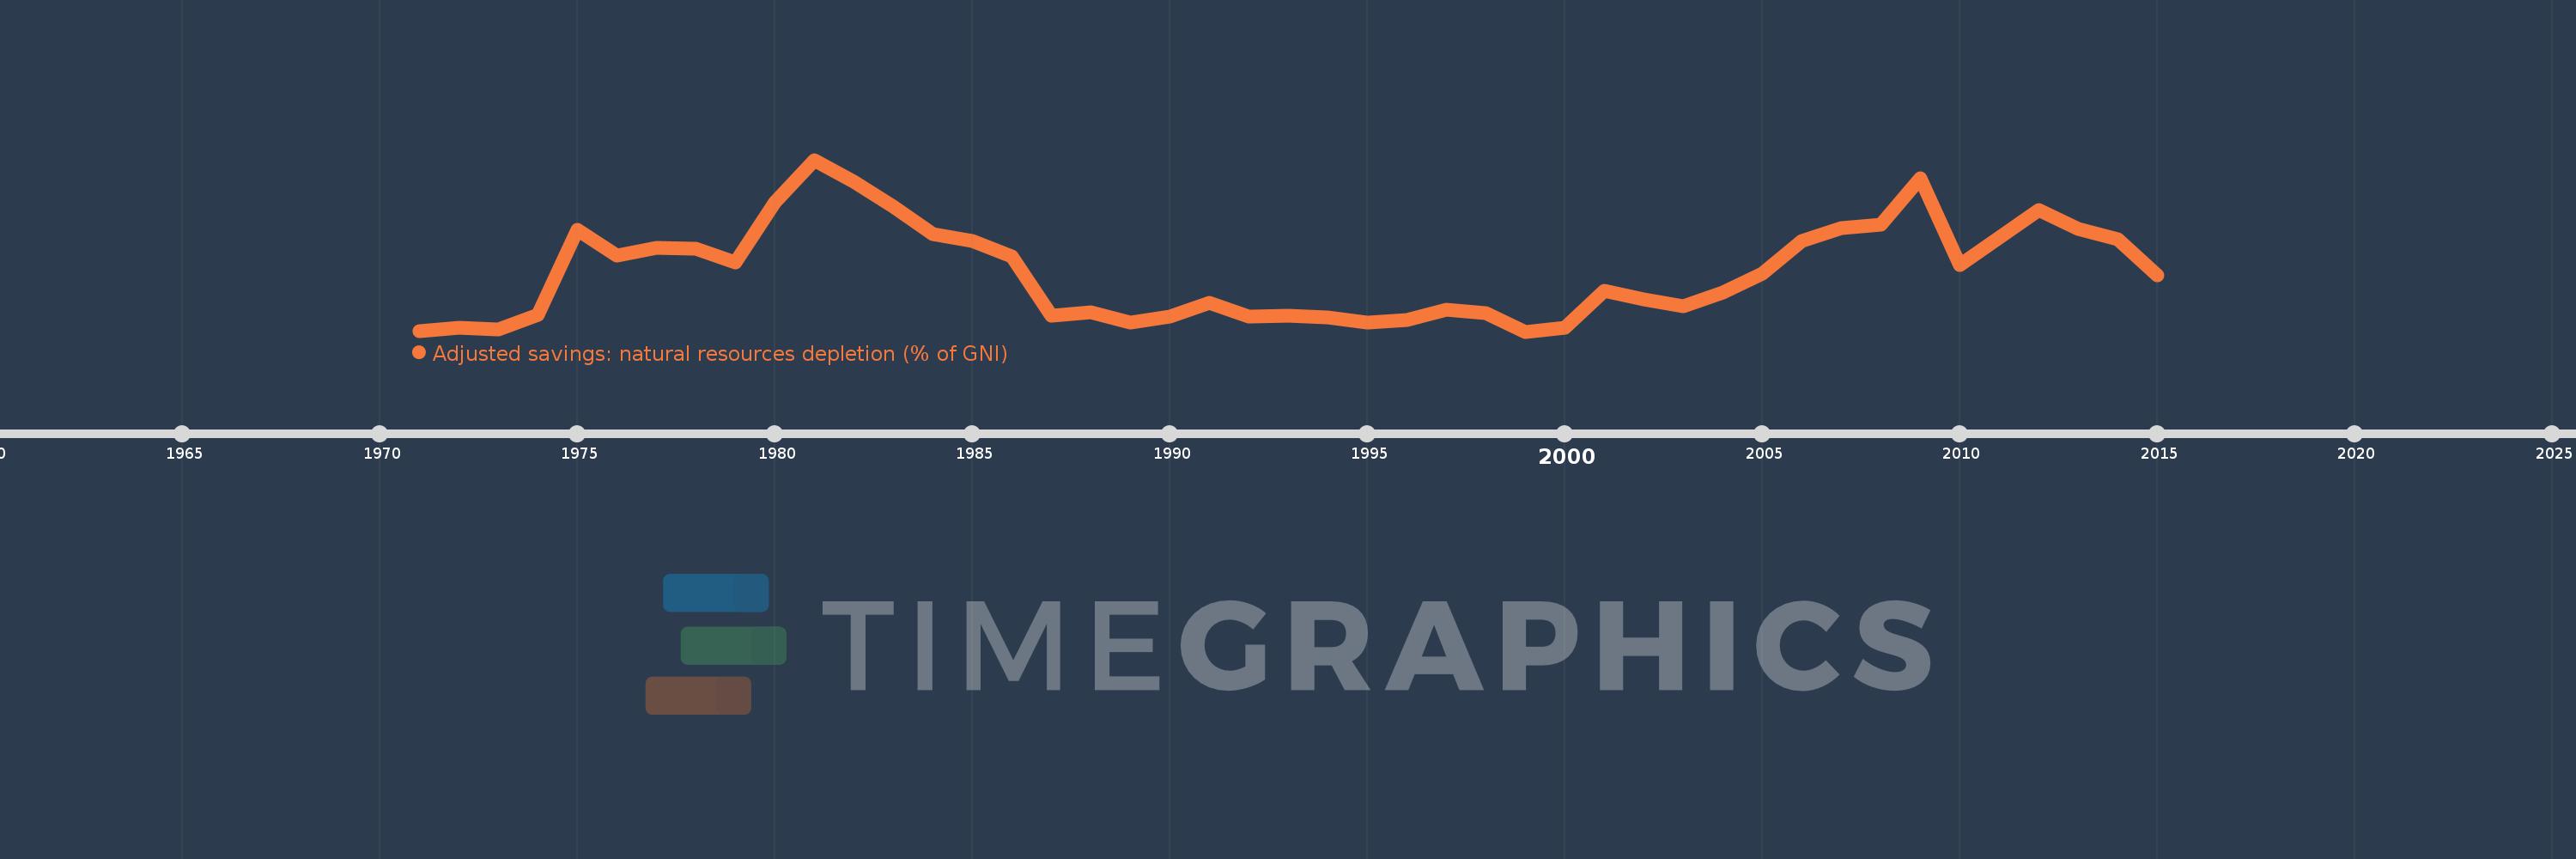
Adjusted savings: natural resources depletion (% of GNI)
2015,2014,2013,2012,2011,2010,2009,2008,2007,2006,2005,2004,2003,2002,2001,2000,1999,1998,1997,1996,1995,1994,1993,1992,1991,1990,1989,1988,1987,1986,1985,1984,1983,1982,1981,1980,1979,1978,1977,1976,1975,1974,1973,1972,1971
This statistics in other country:
AfghanistanAlbaniaAlgeriaAngolaArab WorldArgentinaArmeniaAustraliaAustriaAzerbaijanBahamas, TheBahrainBangladeshBarbadosBelarusBelgiumBelizeBeninBhutanBoliviaBotswanaBrazilBrunei DarussalamBulgariaBurkina FasoBurundiCabo VerdeCambodiaCameroonCanadaCaribbean small statesCentral African RepublicCentral Europe and the BalticsChadChileChinaColombiaComorosCongo, Dem. Rep.Congo, Rep.Costa RicaCote d'IvoireCroatiaCubaCyprusCzech RepublicDenmarkDjiboutiDominicaDominican RepublicEarly-demographic dividendEast Asia & PacificEast Asia & Pacific (excluding high income)East Asia & Pacific (IDA & IBRD countries)EcuadorEgypt, Arab Rep.El SalvadorEquatorial GuineaEritreaEstoniaEthiopiaEuro areaEurope & Central AsiaEurope & Central Asia (excluding high income)Europe & Central Asia (IDA & IBRD countries)European UnionFijiFinlandFragile and conflict affected situationsFranceFrench PolynesiaGabonGambia, TheGeorgiaGermanyGhanaGreeceGuatemalaGuineaGuinea-BissauGuyanaHaitiHeavily indebted poor countries (HIPC)High incomeHondurasHong Kong SAR, ChinaHungaryIBRD onlyIcelandIDA & IBRD totalIDA blendIDA onlyIDA totalIndiaIndonesiaIran, Islamic Rep.IraqIrelandIsraelItalyJamaicaJapanJordanKazakhstanKenyaKiribatiKorea, Rep.KuwaitKyrgyz RepublicLao PDRLate-demographic dividendLatin America & Caribbean Latin America & Caribbean (excluding high income)Latin America & the Caribbean (IDA & IBRD countries)LatviaLeast developed countries: UN classificationLebanonLesothoLiberiaLibyaLithuaniaLow & middle incomeLow incomeLower middle incomeLuxembourgMacedonia, FYRMadagascarMalawiMalaysiaMaldivesMaliMauritaniaMauritiusMexicoMicronesia, Fed. Sts.Middle East & North AfricaMiddle East & North Africa (excluding high income)Middle East & North Africa (IDA & IBRD countries)Middle incomeMoldovaMongoliaMoroccoMozambiqueMyanmarNamibiaNepalNetherlandsNew CaledoniaNew ZealandNicaraguaNigerNigeriaNorth AmericaNorwayOECD membersOmanOther small statesPacific island small statesPakistanPanamaPapua New GuineaParaguayPeruPhilippinesPolandPortugalPost-demographic dividendPre-demographic dividendQatarRomaniaRussian FederationRwandaSamoaSao Tome and PrincipeSaudi ArabiaSenegalSeychellesSierra LeoneSingaporeSlovak RepublicSloveniaSmall statesSolomon IslandsSomaliaSouth AfricaSouth AsiaSouth Asia (IDA & IBRD)SpainSri LankaSt. LuciaSt. Vincent and the GrenadinesSub-Saharan Africa Sub-Saharan Africa (excluding high income)Sub-Saharan Africa (IDA & IBRD countries)SudanSurinameSwazilandSwedenSwitzerlandSyrian Arab RepublicTajikistanTanzaniaThailandTogoTongaTrinidad and TobagoTunisiaTurkeyTurkmenistanUgandaUkraineUnited Arab EmiratesUnited KingdomUnited StatesUpper middle incomeUruguayUzbekistanVanuatuVenezuela, RBVietnamWorldYemen, Rep.ZambiaZimbabwe Timeline:
This timeline shows a graph from 1971 to 2015 of World. No data until 1970. Number of actual observations by date: 45.
Source name:
World Development Indicators
Source organization:
World Bank staff estimates based on sources and methods in World Bank's "The Changing Wealth of Nations: Measuring Sustainable Development in the New Millennium" (2011).
Categories, topics:
Economy & Growth, Energy & Mining
Last updated:
apr 23, 2017
Indicators value changes by year
At the date of observation
Value
Absolute change
Change from previous value
jan 1, 1971
0.725
+0.725
0.0%
jan 1, 1972
0.793
+0.068
9.4%
jan 1, 1973
0.763
-0.03
-3.72%
jan 1, 1974
1.07
+0.306
40.12%
jan 1, 1975
2.916
+1.846
172.61%
jan 1, 1976
2.371
-0.545
-18.68%
jan 1, 1977
2.529
+0.158
6.66%
jan 1, 1978
2.51
-0.02
-0.77%
jan 1, 1979
2.215
-0.295
-11.74%
jan 1, 1980
3.511
+1.296
58.51%
jan 1, 1981
4.439
+0.928
26.42%
jan 1, 1982
3.964
-0.475
-10.69%
jan 1, 1983
3.427
-0.537
-13.54%
jan 1, 1984
2.826
-0.601
-17.54%
jan 1, 1985
2.686
-0.14
-4.95%
jan 1, 1986
2.337
-0.35
-13.01%
jan 1, 1987
1.063
-1.274
-54.52%
jan 1, 1988
1.135
+0.073
6.84%
jan 1, 1989
0.911
-0.224
-19.76%
jan 1, 1990
1.047
+0.136
14.96%
jan 1, 1991
1.347
+0.299
28.56%
jan 1, 1992
1.045
-0.302
-22.41%
jan 1, 1993
1.068
+0.023
2.24%
jan 1, 1994
1.022
-0.046
-4.28%
jan 1, 1995
0.917
-0.105
-10.31%
jan 1, 1996
0.958
+0.041
4.52%
jan 1, 1997
1.192
+0.234
24.37%
jan 1, 1998
1.114
-0.078
-6.57%
jan 1, 1999
0.716
-0.398
-35.72%
jan 1, 2000
0.791
+0.075
10.54%
jan 1, 2001
1.598
+0.807
101.98%
jan 1, 2002
1.414
-0.185
-11.56%
jan 1, 2003
1.269
-0.144
-10.19%
jan 1, 2004
1.572
+0.303
23.87%
jan 1, 2005
1.973
+0.4
25.45%
jan 1, 2006
2.682
+0.709
35.94%
jan 1, 2007
2.963
+0.282
10.5%
jan 1, 2008
3.034
+0.071
2.4%
jan 1, 2009
4.041
+1.007
33.18%
jan 1, 2010
2.164
-1.877
-46.45%
jan 1, 2011
2.76
+0.596
27.56%
jan 1, 2012
3.341
+0.581
21.05%
jan 1, 2013
2.935
-0.406
-12.15%
jan 1, 2014
2.709
-0.226
-7.71%
jan 1, 2015
1.935
-0.774
-28.58%
Ranking of countries by current statistics by years


Comments: