29
/
en
AIzaSyAYiBZKx7MnpbEhh9jyipgxe19OcubqV5w
April 1, 2024
275390
United Kingdom
GBR
true
2
1
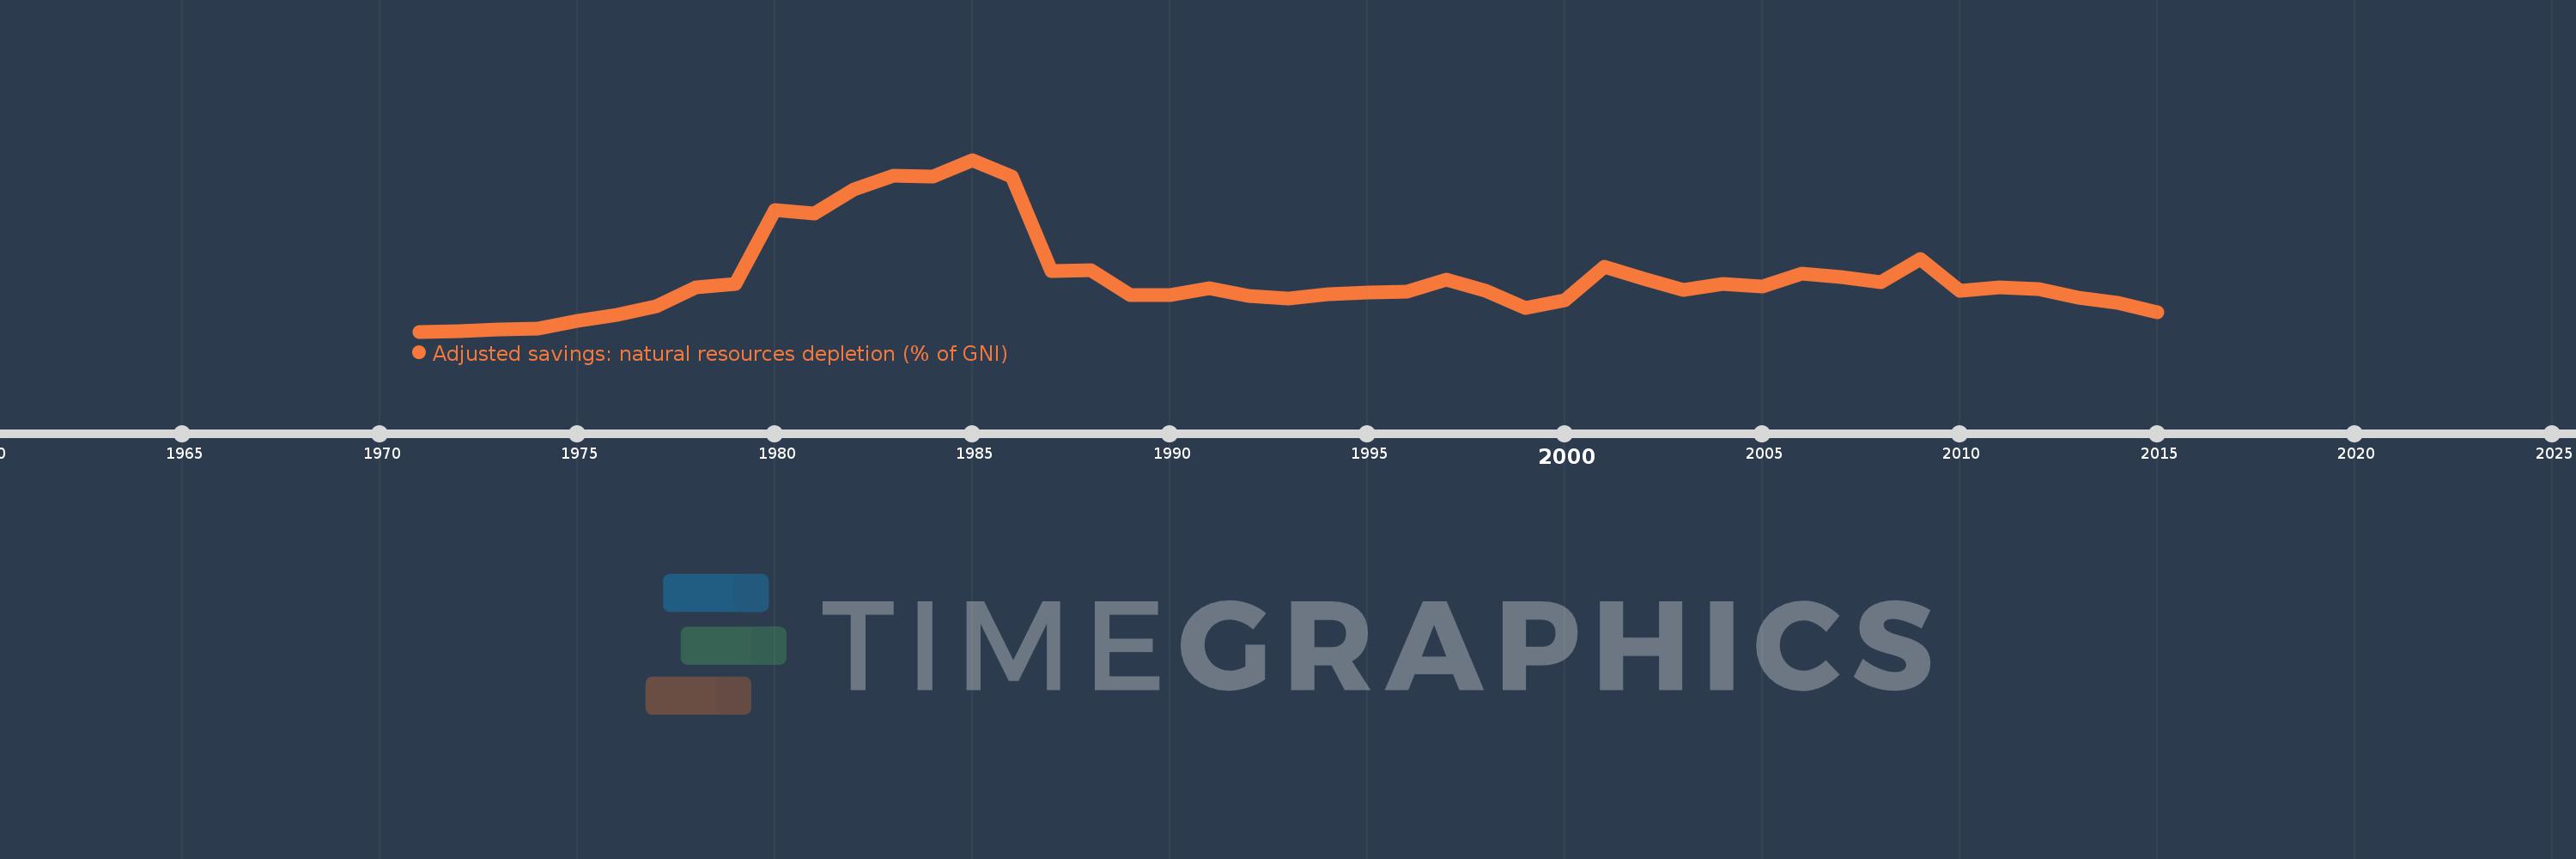
Adjusted savings: natural resources depletion (% of GNI)
2015,2014,2013,2012,2011,2010,2009,2008,2007,2006,2005,2004,2003,2002,2001,2000,1999,1998,1997,1996,1995,1994,1993,1992,1991,1990,1989,1988,1987,1986,1985,1984,1983,1982,1981,1980,1979,1978,1977,1976,1975,1974,1973,1972,1971
This statistics in other country:
AfghanistanAlbaniaAlgeriaAngolaArab WorldArgentinaArmeniaAustraliaAustriaAzerbaijanBahamas, TheBahrainBangladeshBarbadosBelarusBelgiumBelizeBeninBhutanBoliviaBotswanaBrazilBrunei DarussalamBulgariaBurkina FasoBurundiCabo VerdeCambodiaCameroonCanadaCaribbean small statesCentral African RepublicCentral Europe and the BalticsChadChileChinaColombiaComorosCongo, Dem. Rep.Congo, Rep.Costa RicaCote d'IvoireCroatiaCubaCyprusCzech RepublicDenmarkDjiboutiDominicaDominican RepublicEarly-demographic dividendEast Asia & PacificEast Asia & Pacific (excluding high income)East Asia & Pacific (IDA & IBRD countries)EcuadorEgypt, Arab Rep.El SalvadorEquatorial GuineaEritreaEstoniaEthiopiaEuro areaEurope & Central AsiaEurope & Central Asia (excluding high income)Europe & Central Asia (IDA & IBRD countries)European UnionFijiFinlandFragile and conflict affected situationsFranceFrench PolynesiaGabonGambia, TheGeorgiaGermanyGhanaGreeceGuatemalaGuineaGuinea-BissauGuyanaHaitiHeavily indebted poor countries (HIPC)High incomeHondurasHong Kong SAR, ChinaHungaryIBRD onlyIcelandIDA & IBRD totalIDA blendIDA onlyIDA totalIndiaIndonesiaIran, Islamic Rep.IraqIrelandIsraelItalyJamaicaJapanJordanKazakhstanKenyaKiribatiKorea, Rep.KuwaitKyrgyz RepublicLao PDRLate-demographic dividendLatin America & Caribbean Latin America & Caribbean (excluding high income)Latin America & the Caribbean (IDA & IBRD countries)LatviaLeast developed countries: UN classificationLebanonLesothoLiberiaLibyaLithuaniaLow & middle incomeLow incomeLower middle incomeLuxembourgMacedonia, FYRMadagascarMalawiMalaysiaMaldivesMaliMauritaniaMauritiusMexicoMicronesia, Fed. Sts.Middle East & North AfricaMiddle East & North Africa (excluding high income)Middle East & North Africa (IDA & IBRD countries)Middle incomeMoldovaMongoliaMoroccoMozambiqueMyanmarNamibiaNepalNetherlandsNew CaledoniaNew ZealandNicaraguaNigerNigeriaNorth AmericaNorwayOECD membersOmanOther small statesPacific island small statesPakistanPanamaPapua New GuineaParaguayPeruPhilippinesPolandPortugalPost-demographic dividendPre-demographic dividendQatarRomaniaRussian FederationRwandaSamoaSao Tome and PrincipeSaudi ArabiaSenegalSeychellesSierra LeoneSingaporeSlovak RepublicSloveniaSmall statesSolomon IslandsSomaliaSouth AfricaSouth AsiaSouth Asia (IDA & IBRD)SpainSri LankaSt. LuciaSt. Vincent and the GrenadinesSub-Saharan Africa Sub-Saharan Africa (excluding high income)Sub-Saharan Africa (IDA & IBRD countries)SudanSurinameSwazilandSwedenSwitzerlandSyrian Arab RepublicTajikistanTanzaniaThailandTogoTongaTrinidad and TobagoTunisiaTurkeyTurkmenistanUgandaUkraineUnited Arab EmiratesUnited KingdomUnited StatesUpper middle incomeUruguayUzbekistanVanuatuVenezuela, RBVietnamWorldYemen, Rep.ZambiaZimbabwe Timeline:
This timeline shows a graph from 1971 to 2015 of United Kingdom. No data until 1970. Number of actual observations by date: 45.
Source name:
World Development Indicators
Source organization:
World Bank staff estimates based on sources and methods in World Bank's "The Changing Wealth of Nations: Measuring Sustainable Development in the New Millennium" (2011).
Categories, topics:
Economy & Growth, Energy & Mining
Last updated:
apr 23, 2017
Indicators value changes by year
At the date of observation
Value
Absolute change
Change from previous value
jan 1, 1971
0.035
+0.035
0.0%
jan 1, 1972
0.057
+0.022
63.01%
jan 1, 1973
0.093
+0.036
62.76%
jan 1, 1974
0.118
+0.025
26.84%
jan 1, 1975
0.336
+0.218
185.07%
jan 1, 1976
0.485
+0.148
44.08%
jan 1, 1977
0.729
+0.244
50.4%
jan 1, 1978
1.256
+0.527
72.33%
jan 1, 1979
1.356
+0.099
7.92%
jan 1, 1980
3.386
+2.03
149.78%
jan 1, 1981
3.285
-0.101
-2.98%
jan 1, 1982
3.951
+0.666
20.29%
jan 1, 1983
4.338
+0.387
9.78%
jan 1, 1984
4.295
-0.043
-0.98%
jan 1, 1985
4.765
+0.47
10.93%
jan 1, 1986
4.295
-0.47
-9.87%
jan 1, 1987
1.707
-2.588
-60.26%
jan 1, 1988
1.735
+0.028
1.63%
jan 1, 1989
1.037
-0.698
-40.21%
jan 1, 1990
1.037
-0.001
-0.05%
jan 1, 1991
1.241
+0.205
19.75%
jan 1, 1992
1.022
-0.22
-17.69%
jan 1, 1993
0.937
-0.085
-8.31%
jan 1, 1994
1.07
+0.133
14.18%
jan 1, 1995
1.12
+0.05
4.7%
jan 1, 1996
1.141
+0.021
1.9%
jan 1, 1997
1.462
+0.321
28.13%
jan 1, 1998
1.169
-0.293
-20.03%
jan 1, 1999
0.69
-0.479
-40.96%
jan 1, 2000
0.905
+0.215
31.13%
jan 1, 2001
1.827
+0.922
101.81%
jan 1, 2002
1.479
-0.348
-19.07%
jan 1, 2003
1.187
-0.292
-19.73%
jan 1, 2004
1.336
+0.149
12.52%
jan 1, 2005
1.28
-0.056
-4.19%
jan 1, 2006
1.637
+0.358
27.95%
jan 1, 2007
1.546
-0.092
-5.59%
jan 1, 2008
1.393
-0.153
-9.88%
jan 1, 2009
2.025
+0.632
45.39%
jan 1, 2010
1.149
-0.876
-43.26%
jan 1, 2011
1.251
+0.102
8.88%
jan 1, 2012
1.21
-0.041
-3.27%
jan 1, 2013
0.97
-0.24
-19.81%
jan 1, 2014
0.825
-0.145
-14.95%
jan 1, 2015
0.577
-0.248
-30.1%
Ranking of countries by current statistics by years


Comments: