29
/
en
AIzaSyAYiBZKx7MnpbEhh9jyipgxe19OcubqV5w
April 1, 2024
31280
Europe & Central Asia (excluding high income)
ECA
false
2
1
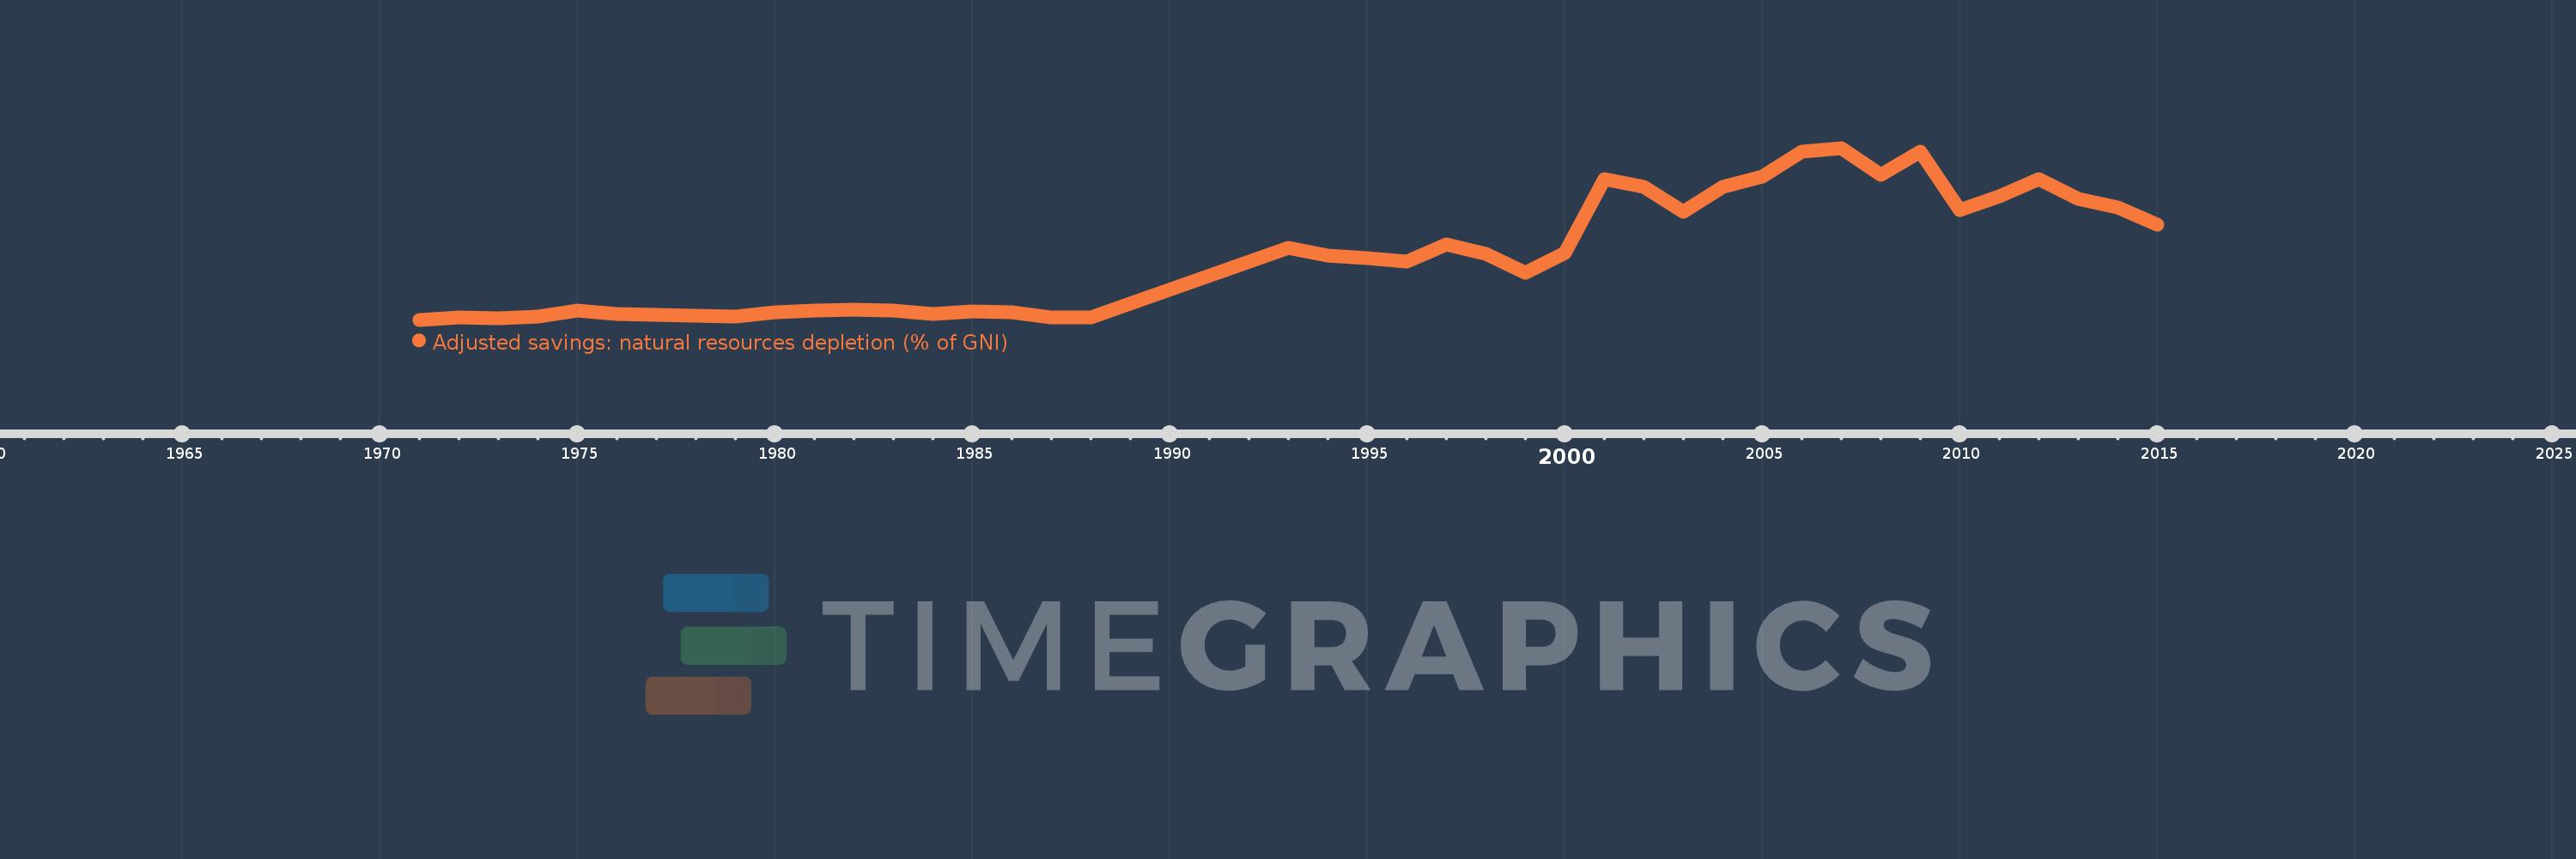
Adjusted savings: natural resources depletion (% of GNI)
2015,2014,2013,2012,2011,2010,2009,2008,2007,2006,2005,2004,2003,2002,2001,2000,1999,1998,1997,1996,1995,1994,1993,1988,1987,1986,1985,1984,1983,1982,1981,1980,1979,1978,1977,1976,1975,1974,1973,1972,1971
This statistics in other country:
AfghanistanAlbaniaAlgeriaAngolaArab WorldArgentinaArmeniaAustraliaAustriaAzerbaijanBahamas, TheBahrainBangladeshBarbadosBelarusBelgiumBelizeBeninBhutanBoliviaBotswanaBrazilBrunei DarussalamBulgariaBurkina FasoBurundiCabo VerdeCambodiaCameroonCanadaCaribbean small statesCentral African RepublicCentral Europe and the BalticsChadChileChinaColombiaComorosCongo, Dem. Rep.Congo, Rep.Costa RicaCote d'IvoireCroatiaCubaCyprusCzech RepublicDenmarkDjiboutiDominicaDominican RepublicEarly-demographic dividendEast Asia & PacificEast Asia & Pacific (excluding high income)East Asia & Pacific (IDA & IBRD countries)EcuadorEgypt, Arab Rep.El SalvadorEquatorial GuineaEritreaEstoniaEthiopiaEuro areaEurope & Central AsiaEurope & Central Asia (excluding high income)Europe & Central Asia (IDA & IBRD countries)European UnionFijiFinlandFragile and conflict affected situationsFranceFrench PolynesiaGabonGambia, TheGeorgiaGermanyGhanaGreeceGuatemalaGuineaGuinea-BissauGuyanaHaitiHeavily indebted poor countries (HIPC)High incomeHondurasHong Kong SAR, ChinaHungaryIBRD onlyIcelandIDA & IBRD totalIDA blendIDA onlyIDA totalIndiaIndonesiaIran, Islamic Rep.IraqIrelandIsraelItalyJamaicaJapanJordanKazakhstanKenyaKiribatiKorea, Rep.KuwaitKyrgyz RepublicLao PDRLate-demographic dividendLatin America & Caribbean Latin America & Caribbean (excluding high income)Latin America & the Caribbean (IDA & IBRD countries)LatviaLeast developed countries: UN classificationLebanonLesothoLiberiaLibyaLithuaniaLow & middle incomeLow incomeLower middle incomeLuxembourgMacedonia, FYRMadagascarMalawiMalaysiaMaldivesMaliMauritaniaMauritiusMexicoMicronesia, Fed. Sts.Middle East & North AfricaMiddle East & North Africa (excluding high income)Middle East & North Africa (IDA & IBRD countries)Middle incomeMoldovaMongoliaMoroccoMozambiqueMyanmarNamibiaNepalNetherlandsNew CaledoniaNew ZealandNicaraguaNigerNigeriaNorth AmericaNorwayOECD membersOmanOther small statesPacific island small statesPakistanPanamaPapua New GuineaParaguayPeruPhilippinesPolandPortugalPost-demographic dividendPre-demographic dividendQatarRomaniaRussian FederationRwandaSamoaSao Tome and PrincipeSaudi ArabiaSenegalSeychellesSierra LeoneSingaporeSlovak RepublicSloveniaSmall statesSolomon IslandsSomaliaSouth AfricaSouth AsiaSouth Asia (IDA & IBRD)SpainSri LankaSt. LuciaSt. Vincent and the GrenadinesSub-Saharan Africa Sub-Saharan Africa (excluding high income)Sub-Saharan Africa (IDA & IBRD countries)SudanSurinameSwazilandSwedenSwitzerlandSyrian Arab RepublicTajikistanTanzaniaThailandTogoTongaTrinidad and TobagoTunisiaTurkeyTurkmenistanUgandaUkraineUnited Arab EmiratesUnited KingdomUnited StatesUpper middle incomeUruguayUzbekistanVanuatuVenezuela, RBVietnamWorldYemen, Rep.ZambiaZimbabwe Timeline:
This timeline shows a graph from 1971 to 2015 of Europe & Central Asia (excluding high income). No data until 1970. Number of actual observations by date: 41.
Source name:
World Development Indicators
Source organization:
World Bank staff estimates based on sources and methods in World Bank's "The Changing Wealth of Nations: Measuring Sustainable Development in the New Millennium" (2011).
Categories, topics:
Economy & Growth, Energy & Mining
Last updated:
apr 23, 2017
Indicators value changes by year
Maximum:
12.134
jan 1, 2007
At the date of observation
Value
Absolute change
Change from previous value
jan 1, 1971
0.119
+0.119
0.0%
jan 1, 1972
0.282
+0.164
138.29%
jan 1, 1973
0.228
-0.055
-19.4%
jan 1, 1974
0.353
+0.125
54.91%
jan 1, 1975
0.746
+0.393
111.54%
jan 1, 1976
0.516
-0.23
-30.81%
jan 1, 1977
0.432
-0.084
-16.25%
jan 1, 1978
0.4
-0.032
-7.49%
jan 1, 1979
0.365
-0.035
-8.7%
jan 1, 1980
0.658
+0.292
80.08%
jan 1, 1981
0.786
+0.128
19.52%
jan 1, 1982
0.806
+0.02
2.51%
jan 1, 1983
0.732
-0.073
-9.12%
jan 1, 1984
0.534
-0.198
-27.07%
jan 1, 1985
0.684
+0.15
28.17%
jan 1, 1986
0.631
-0.053
-7.82%
jan 1, 1987
0.286
-0.345
-54.69%
jan 1, 1988
0.306
+0.02
6.89%
jan 1, 1993
5.176
+4.871
1.59K%
jan 1, 1994
4.624
-0.553
-10.68%
jan 1, 1995
4.42
-0.203
-4.39%
jan 1, 1996
4.213
-0.208
-4.7%
jan 1, 1997
5.414
+1.202
28.53%
jan 1, 1998
4.721
-0.693
-12.8%
jan 1, 1999
3.424
-1.297
-27.47%
jan 1, 2000
4.79
+1.366
39.89%
jan 1, 2001
9.966
+5.176
108.04%
jan 1, 2002
9.4
-0.566
-5.68%
jan 1, 2003
7.668
-1.732
-18.43%
jan 1, 2004
9.441
+1.773
23.12%
jan 1, 2005
10.118
+0.678
7.18%
jan 1, 2006
11.867
+1.749
17.28%
jan 1, 2007
12.134
+0.266
2.25%
jan 1, 2008
10.264
-1.869
-15.41%
jan 1, 2009
11.894
+1.63
15.88%
jan 1, 2010
7.815
-4.079
-34.29%
jan 1, 2011
8.756
+0.94
12.03%
jan 1, 2012
9.924
+1.169
13.35%
jan 1, 2013
8.589
-1.336
-13.46%
jan 1, 2014
7.958
-0.631
-7.34%
jan 1, 2015
6.755
-1.203
-15.12%
Ranking of countries by current statistics by years


Comments: