29
/
en
AIzaSyAYiBZKx7MnpbEhh9jyipgxe19OcubqV5w
April 1, 2024
55295
Pre-demographic dividend
PRE
false
2
1
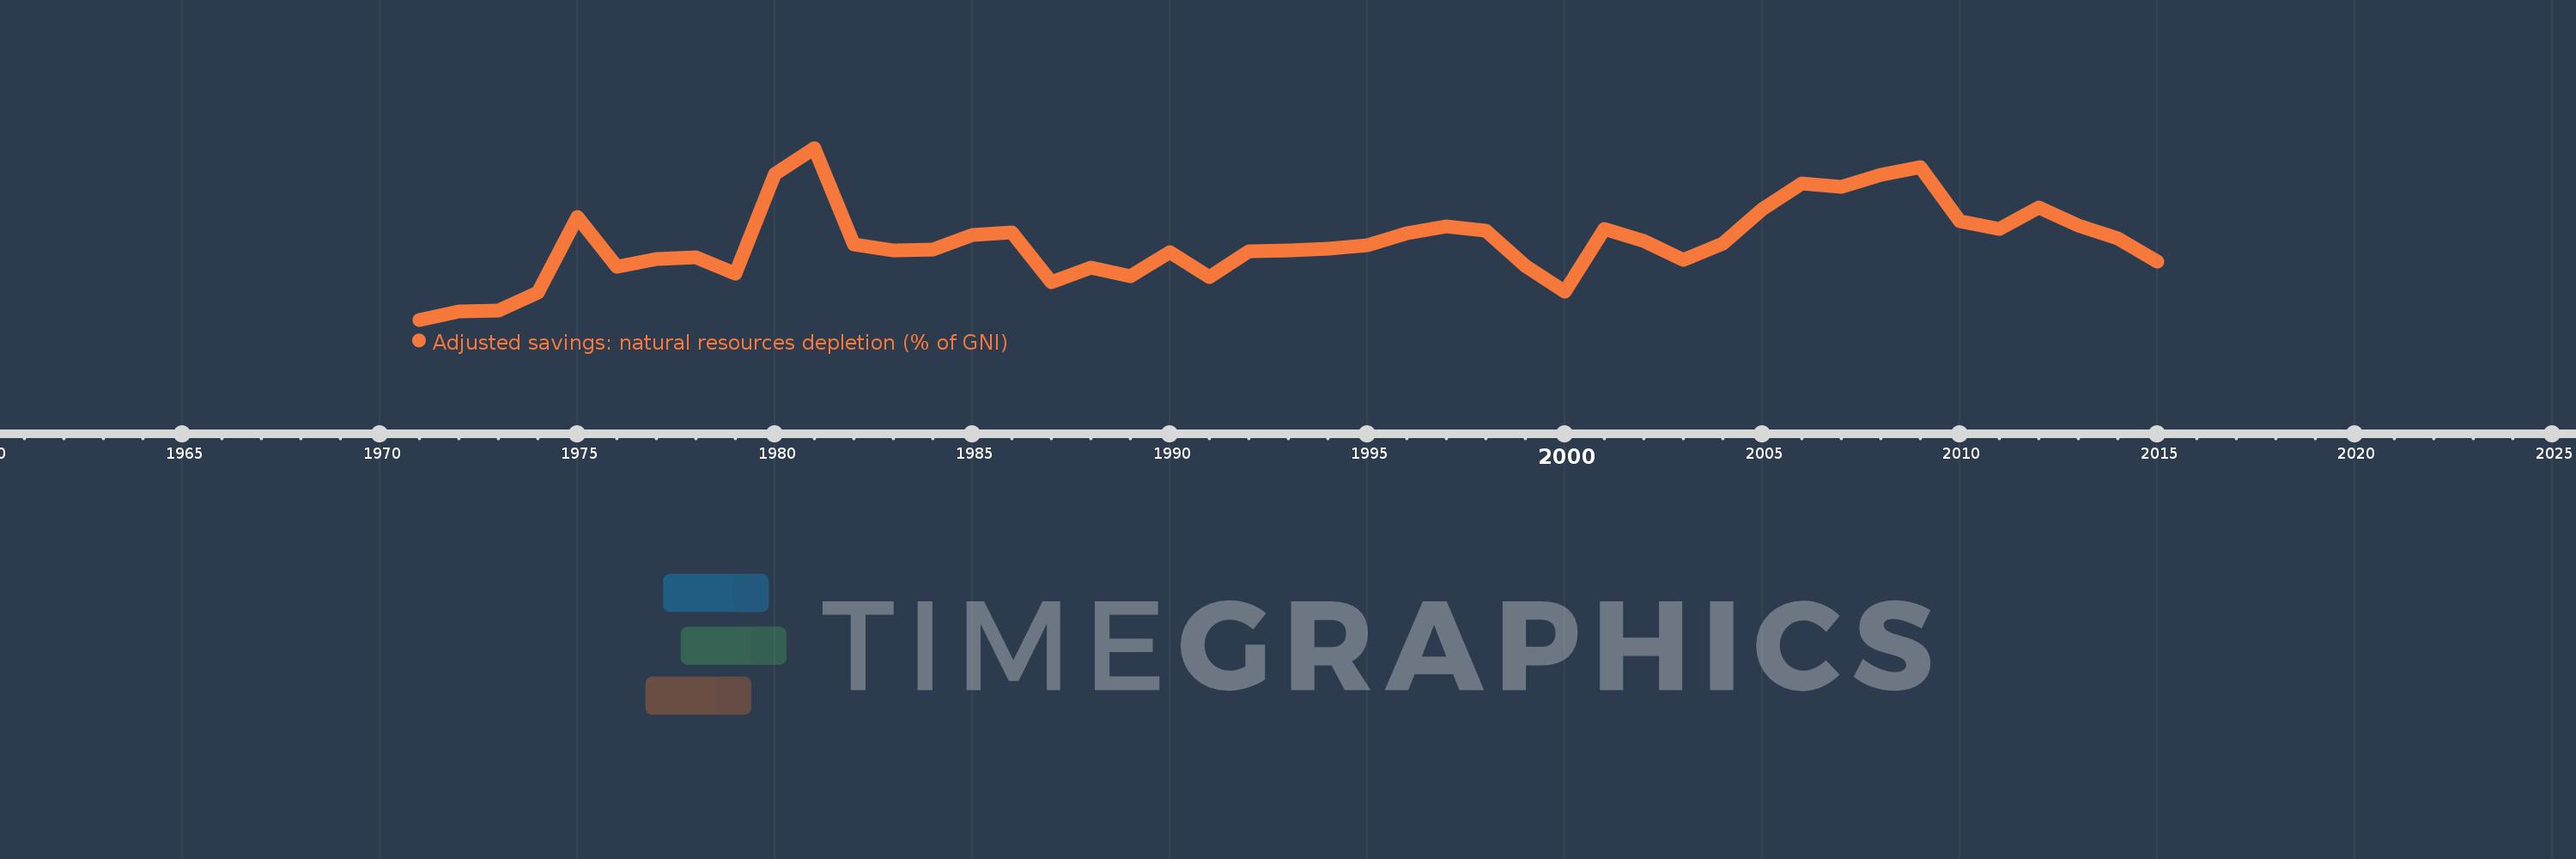
Adjusted savings: natural resources depletion (% of GNI)
2015,2014,2013,2012,2011,2010,2009,2008,2007,2006,2005,2004,2003,2002,2001,2000,1999,1998,1997,1996,1995,1994,1993,1992,1991,1990,1989,1988,1987,1986,1985,1984,1983,1982,1981,1980,1979,1978,1977,1976,1975,1974,1973,1972,1971
This statistics in other country:
AfghanistanAlbaniaAlgeriaAngolaArab WorldArgentinaArmeniaAustraliaAustriaAzerbaijanBahamas, TheBahrainBangladeshBarbadosBelarusBelgiumBelizeBeninBhutanBoliviaBotswanaBrazilBrunei DarussalamBulgariaBurkina FasoBurundiCabo VerdeCambodiaCameroonCanadaCaribbean small statesCentral African RepublicCentral Europe and the BalticsChadChileChinaColombiaComorosCongo, Dem. Rep.Congo, Rep.Costa RicaCote d'IvoireCroatiaCubaCyprusCzech RepublicDenmarkDjiboutiDominicaDominican RepublicEarly-demographic dividendEast Asia & PacificEast Asia & Pacific (excluding high income)East Asia & Pacific (IDA & IBRD countries)EcuadorEgypt, Arab Rep.El SalvadorEquatorial GuineaEritreaEstoniaEthiopiaEuro areaEurope & Central AsiaEurope & Central Asia (excluding high income)Europe & Central Asia (IDA & IBRD countries)European UnionFijiFinlandFragile and conflict affected situationsFranceFrench PolynesiaGabonGambia, TheGeorgiaGermanyGhanaGreeceGuatemalaGuineaGuinea-BissauGuyanaHaitiHeavily indebted poor countries (HIPC)High incomeHondurasHong Kong SAR, ChinaHungaryIBRD onlyIcelandIDA & IBRD totalIDA blendIDA onlyIDA totalIndiaIndonesiaIran, Islamic Rep.IraqIrelandIsraelItalyJamaicaJapanJordanKazakhstanKenyaKiribatiKorea, Rep.KuwaitKyrgyz RepublicLao PDRLate-demographic dividendLatin America & Caribbean Latin America & Caribbean (excluding high income)Latin America & the Caribbean (IDA & IBRD countries)LatviaLeast developed countries: UN classificationLebanonLesothoLiberiaLibyaLithuaniaLow & middle incomeLow incomeLower middle incomeLuxembourgMacedonia, FYRMadagascarMalawiMalaysiaMaldivesMaliMauritaniaMauritiusMexicoMicronesia, Fed. Sts.Middle East & North AfricaMiddle East & North Africa (excluding high income)Middle East & North Africa (IDA & IBRD countries)Middle incomeMoldovaMongoliaMoroccoMozambiqueMyanmarNamibiaNepalNetherlandsNew CaledoniaNew ZealandNicaraguaNigerNigeriaNorth AmericaNorwayOECD membersOmanOther small statesPacific island small statesPakistanPanamaPapua New GuineaParaguayPeruPhilippinesPolandPortugalPost-demographic dividendPre-demographic dividendQatarRomaniaRussian FederationRwandaSamoaSao Tome and PrincipeSaudi ArabiaSenegalSeychellesSierra LeoneSingaporeSlovak RepublicSloveniaSmall statesSolomon IslandsSomaliaSouth AfricaSouth AsiaSouth Asia (IDA & IBRD)SpainSri LankaSt. LuciaSt. Vincent and the GrenadinesSub-Saharan Africa Sub-Saharan Africa (excluding high income)Sub-Saharan Africa (IDA & IBRD countries)SudanSurinameSwazilandSwedenSwitzerlandSyrian Arab RepublicTajikistanTanzaniaThailandTogoTongaTrinidad and TobagoTunisiaTurkeyTurkmenistanUgandaUkraineUnited Arab EmiratesUnited KingdomUnited StatesUpper middle incomeUruguayUzbekistanVanuatuVenezuela, RBVietnamWorldYemen, Rep.ZambiaZimbabwe Timeline:
This timeline shows a graph from 1971 to 2015 of Pre-demographic dividend. No data until 1970. Number of actual observations by date: 45.
Source name:
World Development Indicators
Source organization:
World Bank staff estimates based on sources and methods in World Bank's "The Changing Wealth of Nations: Measuring Sustainable Development in the New Millennium" (2011).
Categories, topics:
Economy & Growth, Energy & Mining
Last updated:
apr 23, 2017
Indicators value changes by year
Maximum:
23.459
jan 1, 1981
At the date of observation
Value
Absolute change
Change from previous value
jan 1, 1971
2.956
+2.956
0.0%
jan 1, 1972
3.931
+0.975
32.98%
jan 1, 1973
4.079
+0.148
3.76%
jan 1, 1974
6.231
+2.152
52.77%
jan 1, 1975
15.186
+8.955
143.71%
jan 1, 1976
9.236
-5.95
-39.18%
jan 1, 1977
10.217
+0.981
10.62%
jan 1, 1978
10.416
+0.199
1.95%
jan 1, 1979
8.464
-1.952
-18.74%
jan 1, 1980
20.4
+11.935
141.01%
jan 1, 1981
23.459
+3.059
15.0%
jan 1, 1982
11.908
-11.551
-49.24%
jan 1, 1983
11.223
-0.684
-5.75%
jan 1, 1984
11.372
+0.149
1.32%
jan 1, 1985
13.031
+1.659
14.59%
jan 1, 1986
13.354
+0.323
2.48%
jan 1, 1987
7.45
-5.904
-44.21%
jan 1, 1988
9.221
+1.772
23.78%
jan 1, 1989
8.108
-1.113
-12.07%
jan 1, 1990
11.065
+2.957
36.47%
jan 1, 1991
8.018
-3.047
-27.53%
jan 1, 1992
11.174
+3.156
39.36%
jan 1, 1993
11.213
+0.038
0.34%
jan 1, 1994
11.483
+0.27
2.41%
jan 1, 1995
11.825
+0.342
2.98%
jan 1, 1996
13.237
+1.412
11.94%
jan 1, 1997
14.057
+0.819
6.19%
jan 1, 1998
13.548
-0.509
-3.62%
jan 1, 1999
9.387
-4.161
-30.71%
jan 1, 2000
6.313
-3.073
-32.74%
jan 1, 2001
13.795
+7.481
118.49%
jan 1, 2002
12.323
-1.472
-10.67%
jan 1, 2003
10.057
-2.266
-18.39%
jan 1, 2004
12.041
+1.984
19.73%
jan 1, 2005
16.192
+4.151
34.48%
jan 1, 2006
19.233
+3.04
18.78%
jan 1, 2007
18.843
-0.39
-2.03%
jan 1, 2008
20.292
+1.45
7.69%
jan 1, 2009
21.145
+0.852
4.2%
jan 1, 2010
14.71
-6.435
-30.43%
jan 1, 2011
13.79
-0.92
-6.26%
jan 1, 2012
16.344
+2.555
18.53%
jan 1, 2013
14.214
-2.13
-13.03%
jan 1, 2014
12.617
-1.597
-11.24%
jan 1, 2015
9.878
-2.739
-21.71%
Ranking of countries by current statistics by years


Comments: