29
/
en
AIzaSyAYiBZKx7MnpbEhh9jyipgxe19OcubqV5w
April 1, 2024
72669
Australia
AUS
true
2
1
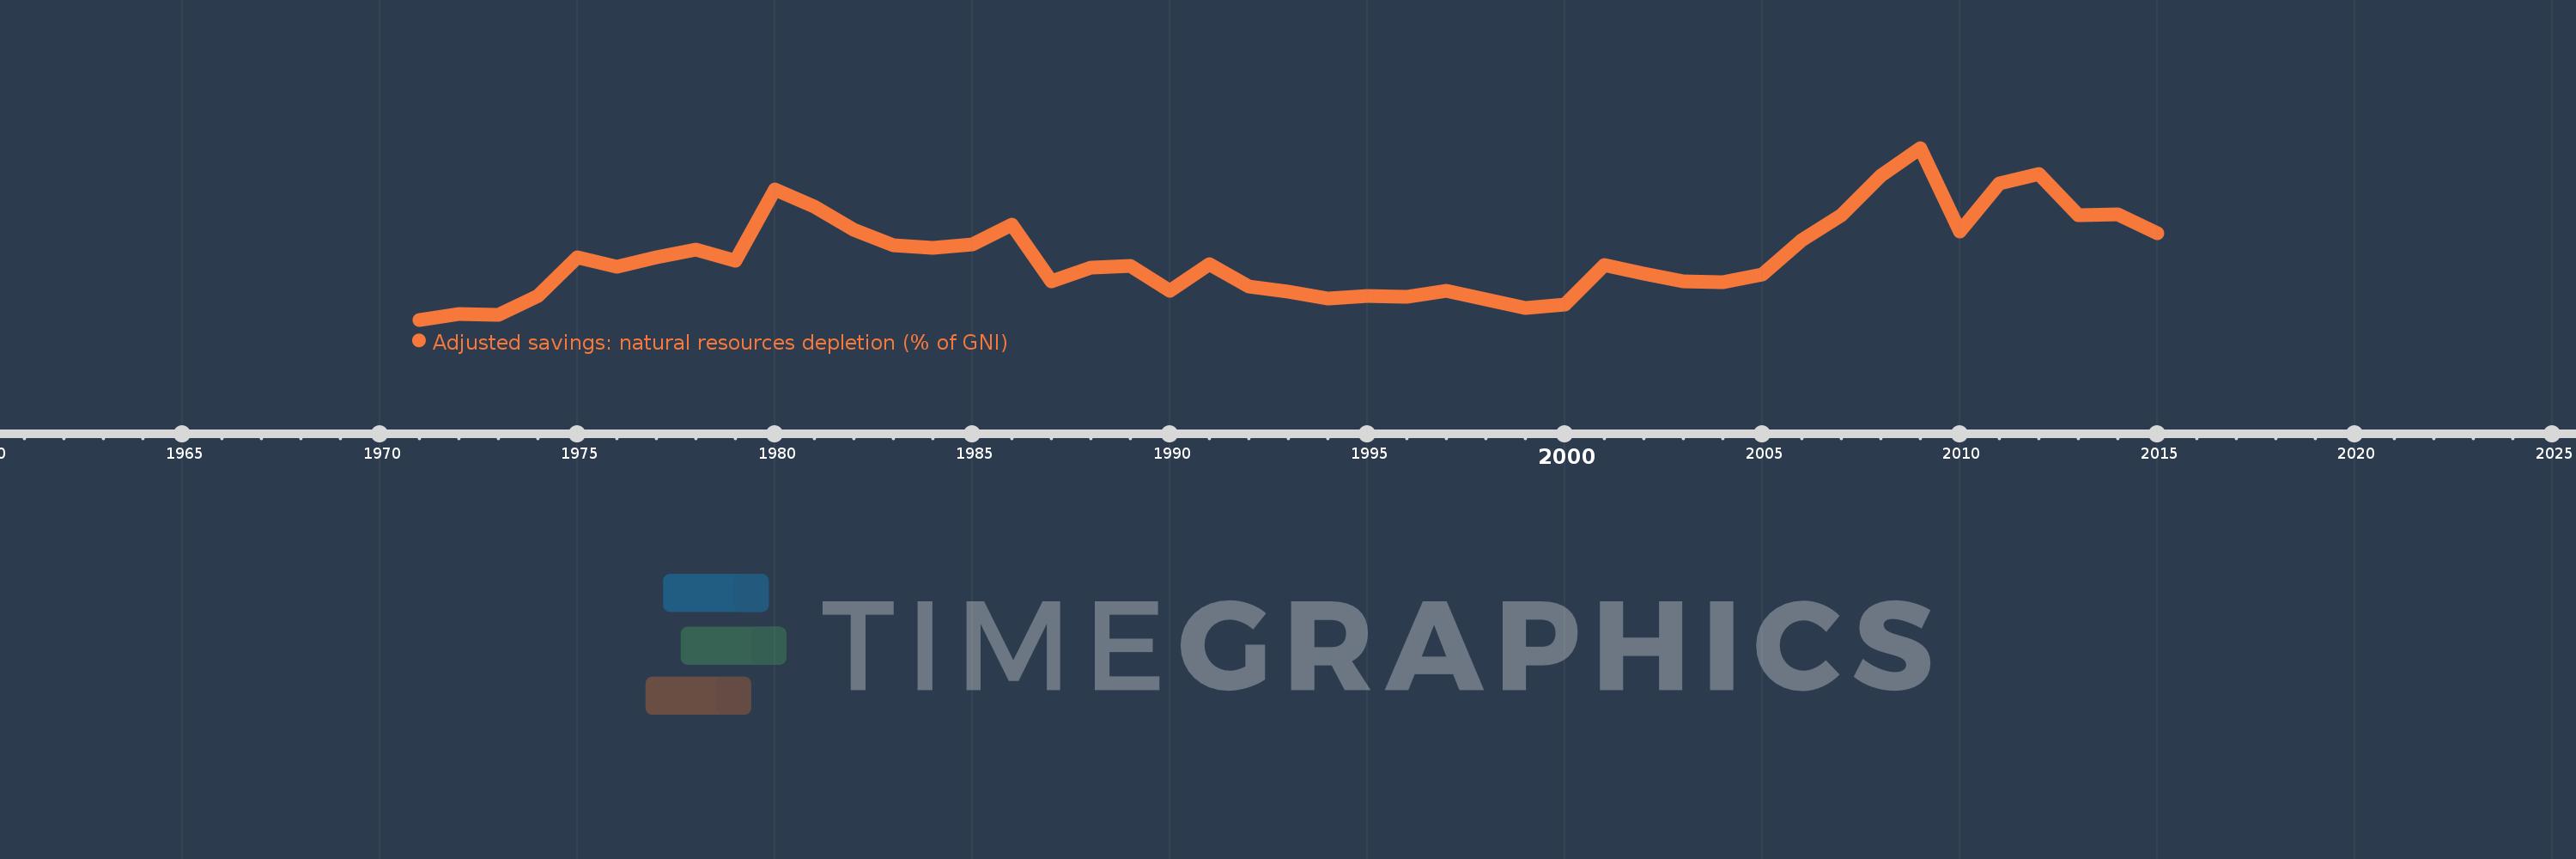
Adjusted savings: natural resources depletion (% of GNI)
2015,2014,2013,2012,2011,2010,2009,2008,2007,2006,2005,2004,2003,2002,2001,2000,1999,1998,1997,1996,1995,1994,1993,1992,1991,1990,1989,1988,1987,1986,1985,1984,1983,1982,1981,1980,1979,1978,1977,1976,1975,1974,1973,1972,1971
This statistics in other country:
AfghanistanAlbaniaAlgeriaAngolaArab WorldArgentinaArmeniaAustraliaAustriaAzerbaijanBahamas, TheBahrainBangladeshBarbadosBelarusBelgiumBelizeBeninBhutanBoliviaBotswanaBrazilBrunei DarussalamBulgariaBurkina FasoBurundiCabo VerdeCambodiaCameroonCanadaCaribbean small statesCentral African RepublicCentral Europe and the BalticsChadChileChinaColombiaComorosCongo, Dem. Rep.Congo, Rep.Costa RicaCote d'IvoireCroatiaCubaCyprusCzech RepublicDenmarkDjiboutiDominicaDominican RepublicEarly-demographic dividendEast Asia & PacificEast Asia & Pacific (excluding high income)East Asia & Pacific (IDA & IBRD countries)EcuadorEgypt, Arab Rep.El SalvadorEquatorial GuineaEritreaEstoniaEthiopiaEuro areaEurope & Central AsiaEurope & Central Asia (excluding high income)Europe & Central Asia (IDA & IBRD countries)European UnionFijiFinlandFragile and conflict affected situationsFranceFrench PolynesiaGabonGambia, TheGeorgiaGermanyGhanaGreeceGuatemalaGuineaGuinea-BissauGuyanaHaitiHeavily indebted poor countries (HIPC)High incomeHondurasHong Kong SAR, ChinaHungaryIBRD onlyIcelandIDA & IBRD totalIDA blendIDA onlyIDA totalIndiaIndonesiaIran, Islamic Rep.IraqIrelandIsraelItalyJamaicaJapanJordanKazakhstanKenyaKiribatiKorea, Rep.KuwaitKyrgyz RepublicLao PDRLate-demographic dividendLatin America & Caribbean Latin America & Caribbean (excluding high income)Latin America & the Caribbean (IDA & IBRD countries)LatviaLeast developed countries: UN classificationLebanonLesothoLiberiaLibyaLithuaniaLow & middle incomeLow incomeLower middle incomeLuxembourgMacedonia, FYRMadagascarMalawiMalaysiaMaldivesMaliMauritaniaMauritiusMexicoMicronesia, Fed. Sts.Middle East & North AfricaMiddle East & North Africa (excluding high income)Middle East & North Africa (IDA & IBRD countries)Middle incomeMoldovaMongoliaMoroccoMozambiqueMyanmarNamibiaNepalNetherlandsNew CaledoniaNew ZealandNicaraguaNigerNigeriaNorth AmericaNorwayOECD membersOmanOther small statesPacific island small statesPakistanPanamaPapua New GuineaParaguayPeruPhilippinesPolandPortugalPost-demographic dividendPre-demographic dividendQatarRomaniaRussian FederationRwandaSamoaSao Tome and PrincipeSaudi ArabiaSenegalSeychellesSierra LeoneSingaporeSlovak RepublicSloveniaSmall statesSolomon IslandsSomaliaSouth AfricaSouth AsiaSouth Asia (IDA & IBRD)SpainSri LankaSt. LuciaSt. Vincent and the GrenadinesSub-Saharan Africa Sub-Saharan Africa (excluding high income)Sub-Saharan Africa (IDA & IBRD countries)SudanSurinameSwazilandSwedenSwitzerlandSyrian Arab RepublicTajikistanTanzaniaThailandTogoTongaTrinidad and TobagoTunisiaTurkeyTurkmenistanUgandaUkraineUnited Arab EmiratesUnited KingdomUnited StatesUpper middle incomeUruguayUzbekistanVanuatuVenezuela, RBVietnamWorldYemen, Rep.ZambiaZimbabwe Timeline:
This timeline shows a graph from 1971 to 2015 of Australia. No data until 1970. Number of actual observations by date: 45.
Source name:
World Development Indicators
Source organization:
World Bank staff estimates based on sources and methods in World Bank's "The Changing Wealth of Nations: Measuring Sustainable Development in the New Millennium" (2011).
Categories, topics:
Economy & Growth, Energy & Mining
Last updated:
apr 23, 2017
Indicators value changes by year
At the date of observation
Value
Absolute change
Change from previous value
jan 1, 1971
0.833
+0.833
0.0%
jan 1, 1972
0.994
+0.161
19.29%
jan 1, 1973
0.979
-0.016
-1.56%
jan 1, 1974
1.513
+0.534
54.61%
jan 1, 1975
2.647
+1.133
74.9%
jan 1, 1976
2.368
-0.278
-10.52%
jan 1, 1977
2.636
+0.268
11.31%
jan 1, 1978
2.854
+0.218
8.26%
jan 1, 1979
2.535
-0.319
-11.18%
jan 1, 1980
4.598
+2.064
81.43%
jan 1, 1981
4.113
-0.486
-10.56%
jan 1, 1982
3.444
-0.668
-16.25%
jan 1, 1983
2.997
-0.447
-12.99%
jan 1, 1984
2.919
-0.078
-2.62%
jan 1, 1985
3.006
+0.088
3.01%
jan 1, 1986
3.585
+0.579
19.26%
jan 1, 1987
1.944
-1.641
-45.78%
jan 1, 1988
2.343
+0.399
20.5%
jan 1, 1989
2.396
+0.053
2.27%
jan 1, 1990
1.68
-0.716
-29.9%
jan 1, 1991
2.448
+0.768
45.75%
jan 1, 1992
1.806
-0.642
-26.22%
jan 1, 1993
1.638
-0.168
-9.28%
jan 1, 1994
1.451
-0.187
-11.42%
jan 1, 1995
1.531
+0.08
5.51%
jan 1, 1996
1.504
-0.027
-1.76%
jan 1, 1997
1.663
+0.159
10.56%
jan 1, 1998
1.424
-0.239
-14.4%
jan 1, 1999
1.181
-0.243
-17.07%
jan 1, 2000
1.279
+0.098
8.3%
jan 1, 2001
2.424
+1.145
89.57%
jan 1, 2002
2.177
-0.247
-10.19%
jan 1, 2003
1.94
-0.237
-10.88%
jan 1, 2004
1.926
-0.014
-0.74%
jan 1, 2005
2.142
+0.216
11.22%
jan 1, 2006
3.13
+0.988
46.12%
jan 1, 2007
3.858
+0.729
23.28%
jan 1, 2008
4.992
+1.134
29.38%
jan 1, 2009
5.802
+0.811
16.24%
jan 1, 2010
3.395
-2.407
-41.49%
jan 1, 2011
4.786
+1.391
40.98%
jan 1, 2012
5.057
+0.27
5.65%
jan 1, 2013
3.846
-1.211
-23.95%
jan 1, 2014
3.883
+0.037
0.96%
jan 1, 2015
3.339
-0.544
-14.01%
Ranking of countries by current statistics by years


Comments: