29
/
en
AIzaSyAYiBZKx7MnpbEhh9jyipgxe19OcubqV5w
April 1, 2024
201189
Morocco
MAR
true
2
1
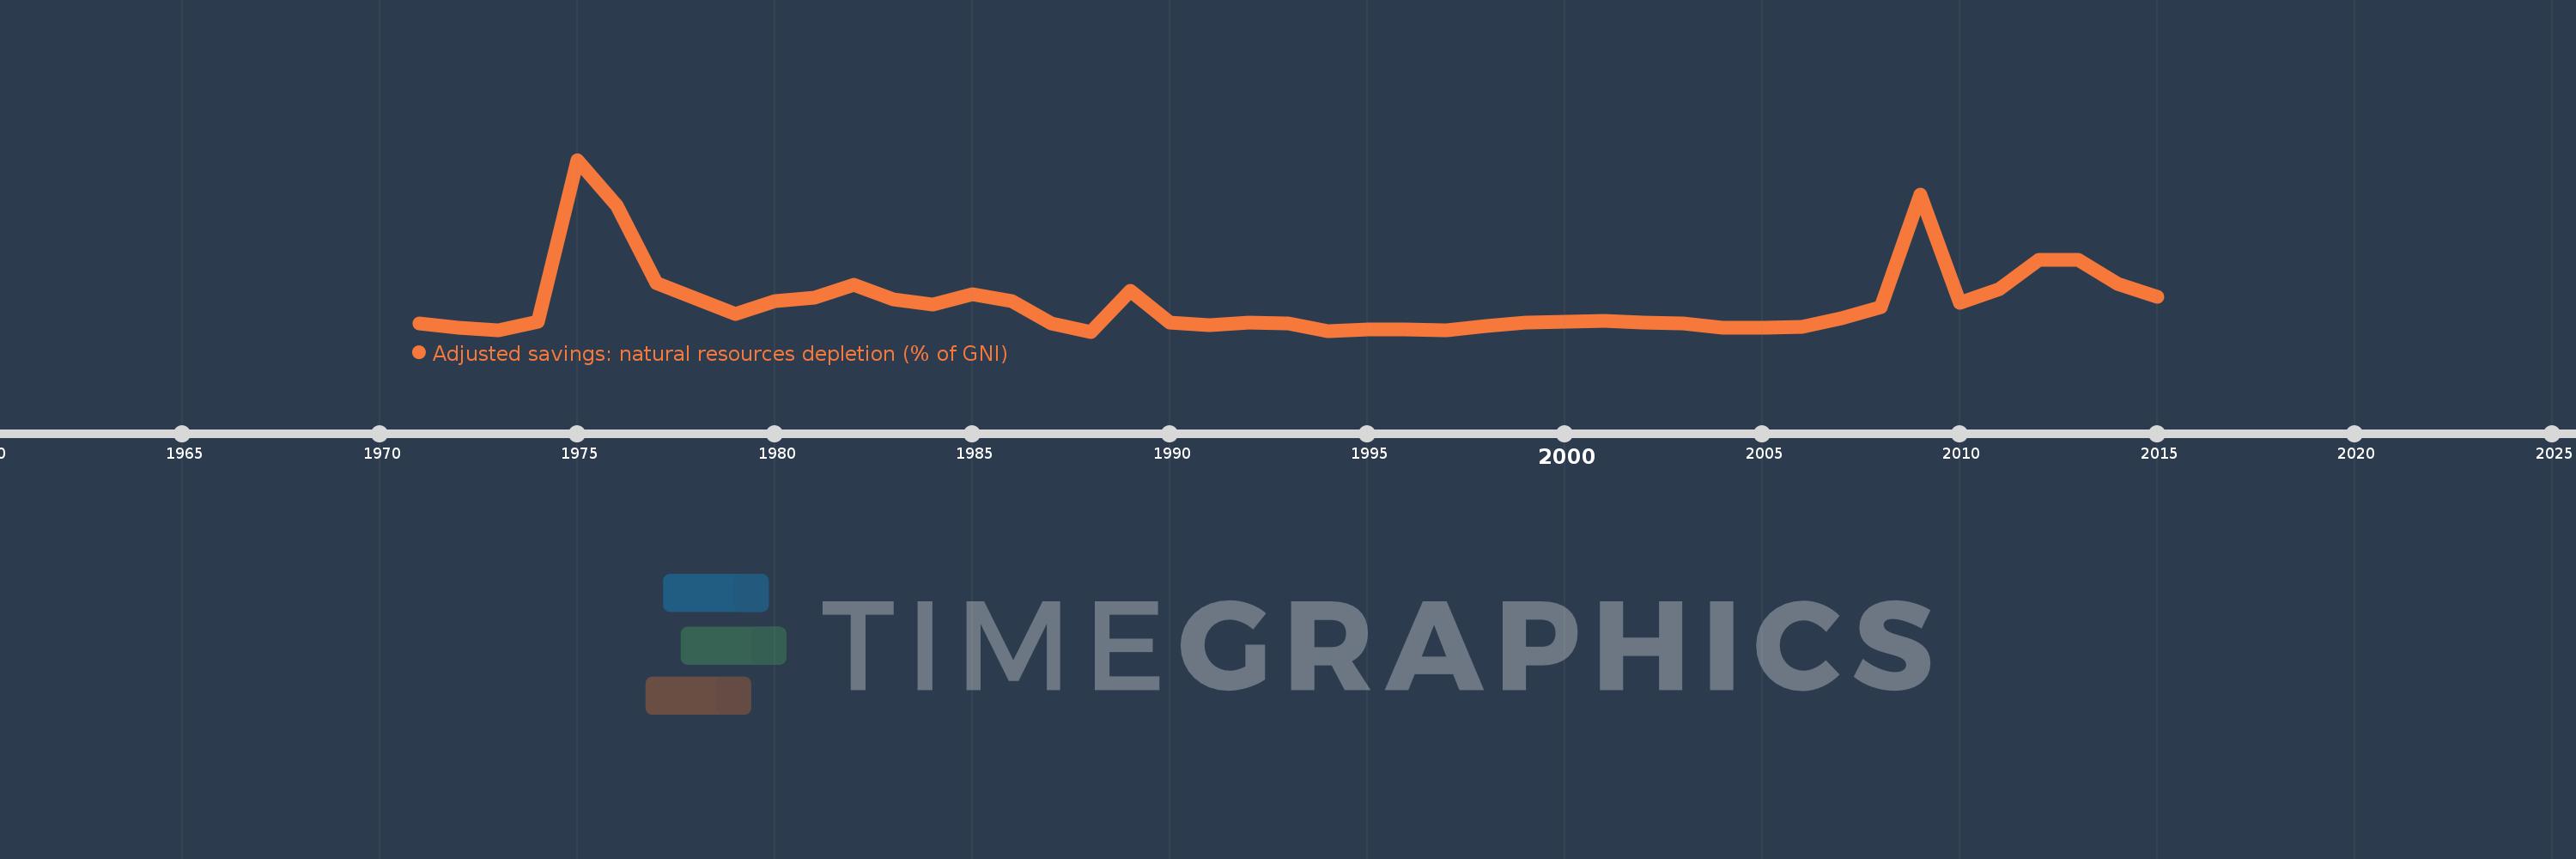
Adjusted savings: natural resources depletion (% of GNI)
2015,2014,2013,2012,2011,2010,2009,2008,2007,2006,2005,2004,2003,2002,2001,2000,1999,1998,1997,1996,1995,1994,1993,1992,1991,1990,1989,1988,1987,1986,1985,1984,1983,1982,1981,1980,1979,1978,1977,1976,1975,1974,1973,1972,1971
This statistics in other country:
AfghanistanAlbaniaAlgeriaAngolaArab WorldArgentinaArmeniaAustraliaAustriaAzerbaijanBahamas, TheBahrainBangladeshBarbadosBelarusBelgiumBelizeBeninBhutanBoliviaBotswanaBrazilBrunei DarussalamBulgariaBurkina FasoBurundiCabo VerdeCambodiaCameroonCanadaCaribbean small statesCentral African RepublicCentral Europe and the BalticsChadChileChinaColombiaComorosCongo, Dem. Rep.Congo, Rep.Costa RicaCote d'IvoireCroatiaCubaCyprusCzech RepublicDenmarkDjiboutiDominicaDominican RepublicEarly-demographic dividendEast Asia & PacificEast Asia & Pacific (excluding high income)East Asia & Pacific (IDA & IBRD countries)EcuadorEgypt, Arab Rep.El SalvadorEquatorial GuineaEritreaEstoniaEthiopiaEuro areaEurope & Central AsiaEurope & Central Asia (excluding high income)Europe & Central Asia (IDA & IBRD countries)European UnionFijiFinlandFragile and conflict affected situationsFranceFrench PolynesiaGabonGambia, TheGeorgiaGermanyGhanaGreeceGuatemalaGuineaGuinea-BissauGuyanaHaitiHeavily indebted poor countries (HIPC)High incomeHondurasHong Kong SAR, ChinaHungaryIBRD onlyIcelandIDA & IBRD totalIDA blendIDA onlyIDA totalIndiaIndonesiaIran, Islamic Rep.IraqIrelandIsraelItalyJamaicaJapanJordanKazakhstanKenyaKiribatiKorea, Rep.KuwaitKyrgyz RepublicLao PDRLate-demographic dividendLatin America & Caribbean Latin America & Caribbean (excluding high income)Latin America & the Caribbean (IDA & IBRD countries)LatviaLeast developed countries: UN classificationLebanonLesothoLiberiaLibyaLithuaniaLow & middle incomeLow incomeLower middle incomeLuxembourgMacedonia, FYRMadagascarMalawiMalaysiaMaldivesMaliMauritaniaMauritiusMexicoMicronesia, Fed. Sts.Middle East & North AfricaMiddle East & North Africa (excluding high income)Middle East & North Africa (IDA & IBRD countries)Middle incomeMoldovaMongoliaMoroccoMozambiqueMyanmarNamibiaNepalNetherlandsNew CaledoniaNew ZealandNicaraguaNigerNigeriaNorth AmericaNorwayOECD membersOmanOther small statesPacific island small statesPakistanPanamaPapua New GuineaParaguayPeruPhilippinesPolandPortugalPost-demographic dividendPre-demographic dividendQatarRomaniaRussian FederationRwandaSamoaSao Tome and PrincipeSaudi ArabiaSenegalSeychellesSierra LeoneSingaporeSlovak RepublicSloveniaSmall statesSolomon IslandsSomaliaSouth AfricaSouth AsiaSouth Asia (IDA & IBRD)SpainSri LankaSt. LuciaSt. Vincent and the GrenadinesSub-Saharan Africa Sub-Saharan Africa (excluding high income)Sub-Saharan Africa (IDA & IBRD countries)SudanSurinameSwazilandSwedenSwitzerlandSyrian Arab RepublicTajikistanTanzaniaThailandTogoTongaTrinidad and TobagoTunisiaTurkeyTurkmenistanUgandaUkraineUnited Arab EmiratesUnited KingdomUnited StatesUpper middle incomeUruguayUzbekistanVanuatuVenezuela, RBVietnamWorldYemen, Rep.ZambiaZimbabwe Timeline:
This timeline shows a graph from 1971 to 2015 of Morocco. No data until 1970. Number of actual observations by date: 45.
Source name:
World Development Indicators
Source organization:
World Bank staff estimates based on sources and methods in World Bank's "The Changing Wealth of Nations: Measuring Sustainable Development in the New Millennium" (2011).
Categories, topics:
Economy & Growth, Energy & Mining
Last updated:
apr 23, 2017
Indicators value changes by year
At the date of observation
Value
Absolute change
Change from previous value
jan 1, 1971
0.259
+0.259
0.0%
jan 1, 1972
0.159
-0.1
-38.51%
jan 1, 1973
0.073
-0.086
-54.09%
jan 1, 1974
0.315
+0.242
331.76%
jan 1, 1975
4.722
+4.406
1.4K%
jan 1, 1976
3.475
-1.246
-26.4%
jan 1, 1977
1.365
-2.11
-60.72%
jan 1, 1978
0.957
-0.408
-29.87%
jan 1, 1979
0.533
-0.424
-44.3%
jan 1, 1980
0.888
+0.355
66.59%
jan 1, 1981
0.97
+0.082
9.21%
jan 1, 1982
1.318
+0.348
35.86%
jan 1, 1983
0.928
-0.39
-29.58%
jan 1, 1984
0.784
-0.144
-15.5%
jan 1, 1985
1.057
+0.273
34.78%
jan 1, 1986
0.878
-0.179
-16.94%
jan 1, 1987
0.269
-0.61
-69.42%
jan 1, 1988
0.048
-0.221
-82.14%
jan 1, 1989
1.149
+1.101
2.3K%
jan 1, 1990
0.302
-0.847
-73.71%
jan 1, 1991
0.223
-0.079
-26.29%
jan 1, 1992
0.295
+0.073
32.66%
jan 1, 1993
0.261
-0.035
-11.79%
jan 1, 1994
0.055
-0.206
-78.99%
jan 1, 1995
0.097
+0.042
76.95%
jan 1, 1996
0.103
+0.006
6.25%
jan 1, 1997
0.09
-0.013
-12.5%
jan 1, 1998
0.197
+0.107
118.72%
jan 1, 1999
0.3
+0.103
52.41%
jan 1, 2000
0.307
+0.007
2.44%
jan 1, 2001
0.335
+0.027
8.83%
jan 1, 2002
0.291
-0.043
-12.99%
jan 1, 2003
0.26
-0.031
-10.61%
jan 1, 2004
0.143
-0.117
-44.88%
jan 1, 2005
0.152
+0.009
6.25%
jan 1, 2006
0.182
+0.029
19.15%
jan 1, 2007
0.416
+0.234
129.03%
jan 1, 2008
0.714
+0.298
71.65%
jan 1, 2009
3.774
+3.06
428.57%
jan 1, 2010
0.832
-2.942
-77.96%
jan 1, 2011
1.209
+0.377
45.33%
jan 1, 2012
1.988
+0.779
64.42%
jan 1, 2013
1.992
+0.004
0.18%
jan 1, 2014
1.35
-0.642
-32.23%
jan 1, 2015
0.997
-0.352
-26.11%
Ranking of countries by current statistics by years


Comments: