29
/
en
AIzaSyAYiBZKx7MnpbEhh9jyipgxe19OcubqV5w
April 1, 2024
104520
Chile
CHL
true
2
1
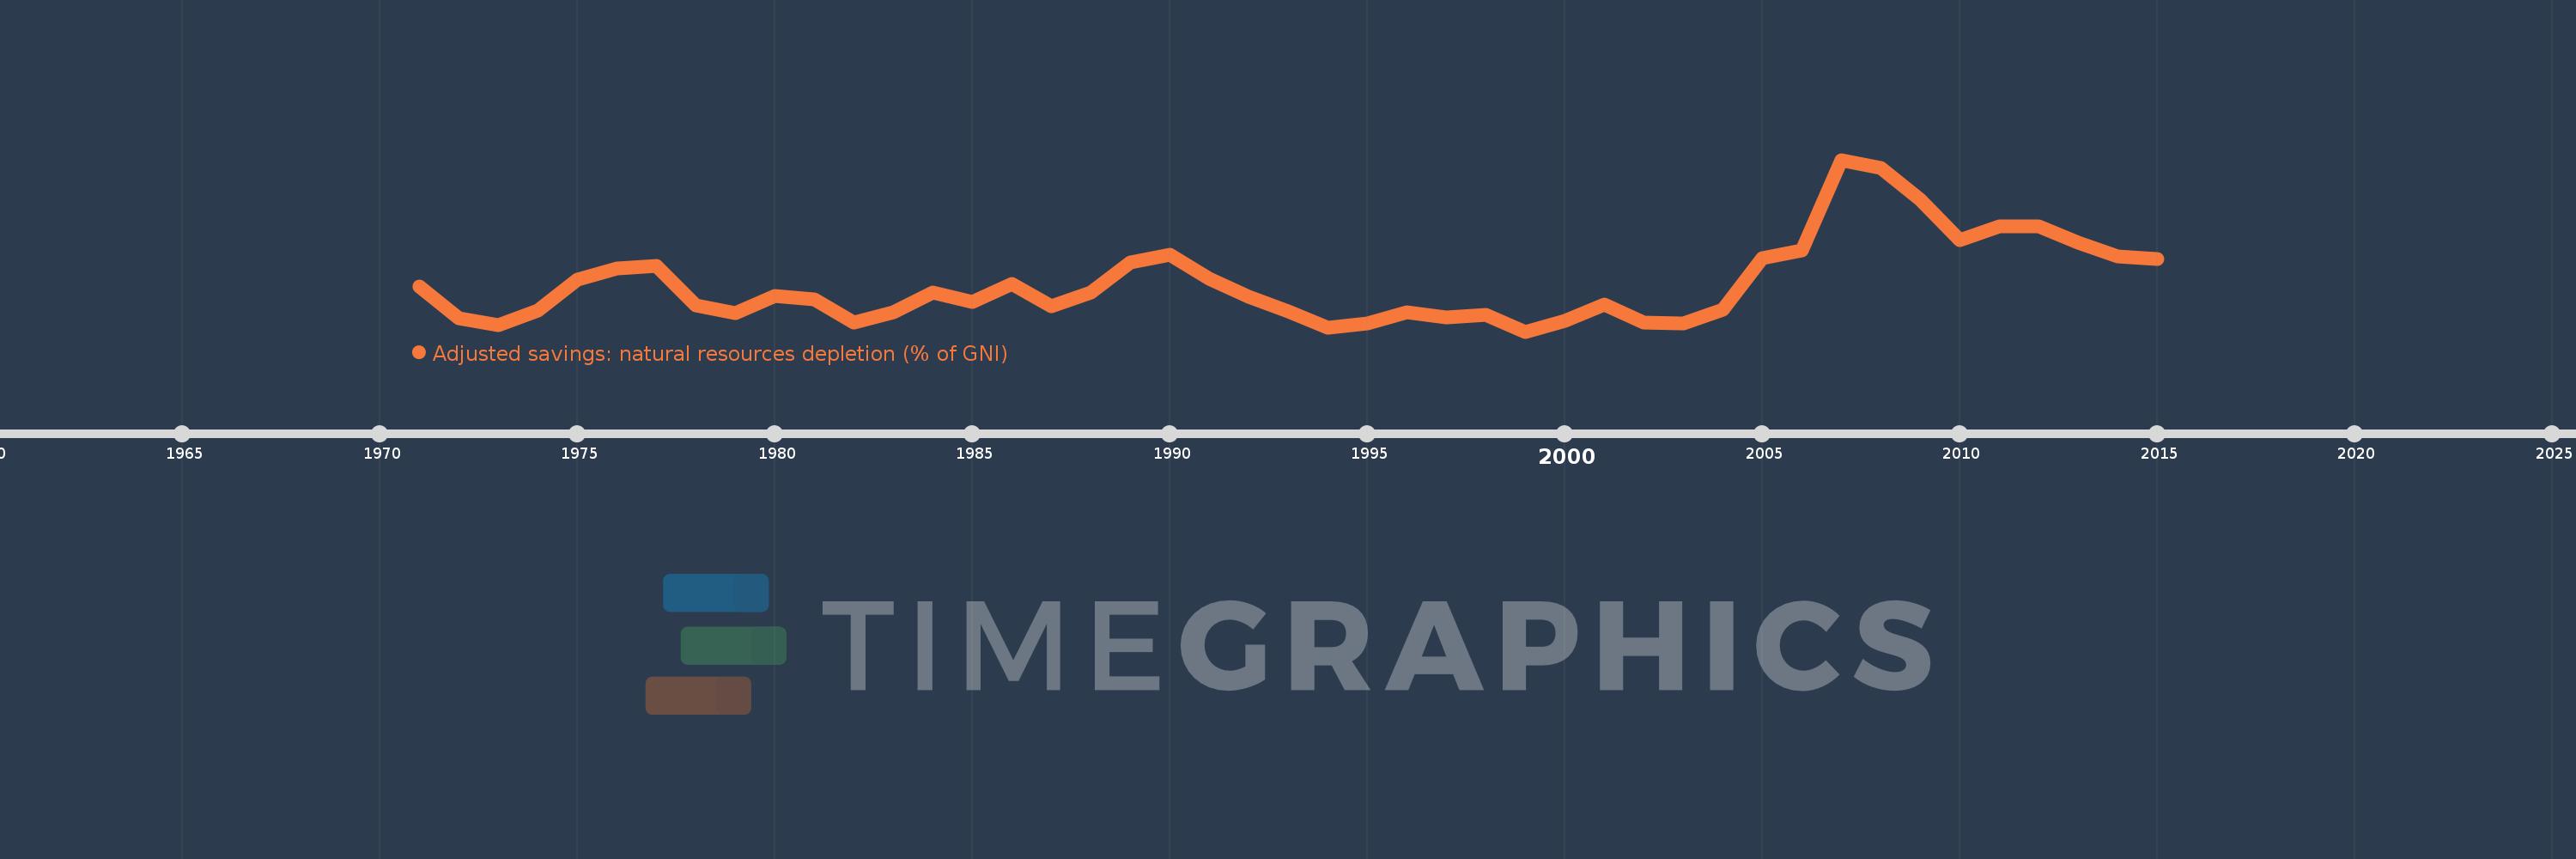
Adjusted savings: natural resources depletion (% of GNI)
2015,2014,2013,2012,2011,2010,2009,2008,2007,2006,2005,2004,2003,2002,2001,2000,1999,1998,1997,1996,1995,1994,1993,1992,1991,1990,1989,1988,1987,1986,1985,1984,1983,1982,1981,1980,1979,1978,1977,1976,1975,1974,1973,1972,1971
This statistics in other country:
AfghanistanAlbaniaAlgeriaAngolaArab WorldArgentinaArmeniaAustraliaAustriaAzerbaijanBahamas, TheBahrainBangladeshBarbadosBelarusBelgiumBelizeBeninBhutanBoliviaBotswanaBrazilBrunei DarussalamBulgariaBurkina FasoBurundiCabo VerdeCambodiaCameroonCanadaCaribbean small statesCentral African RepublicCentral Europe and the BalticsChadChileChinaColombiaComorosCongo, Dem. Rep.Congo, Rep.Costa RicaCote d'IvoireCroatiaCubaCyprusCzech RepublicDenmarkDjiboutiDominicaDominican RepublicEarly-demographic dividendEast Asia & PacificEast Asia & Pacific (excluding high income)East Asia & Pacific (IDA & IBRD countries)EcuadorEgypt, Arab Rep.El SalvadorEquatorial GuineaEritreaEstoniaEthiopiaEuro areaEurope & Central AsiaEurope & Central Asia (excluding high income)Europe & Central Asia (IDA & IBRD countries)European UnionFijiFinlandFragile and conflict affected situationsFranceFrench PolynesiaGabonGambia, TheGeorgiaGermanyGhanaGreeceGuatemalaGuineaGuinea-BissauGuyanaHaitiHeavily indebted poor countries (HIPC)High incomeHondurasHong Kong SAR, ChinaHungaryIBRD onlyIcelandIDA & IBRD totalIDA blendIDA onlyIDA totalIndiaIndonesiaIran, Islamic Rep.IraqIrelandIsraelItalyJamaicaJapanJordanKazakhstanKenyaKiribatiKorea, Rep.KuwaitKyrgyz RepublicLao PDRLate-demographic dividendLatin America & Caribbean Latin America & Caribbean (excluding high income)Latin America & the Caribbean (IDA & IBRD countries)LatviaLeast developed countries: UN classificationLebanonLesothoLiberiaLibyaLithuaniaLow & middle incomeLow incomeLower middle incomeLuxembourgMacedonia, FYRMadagascarMalawiMalaysiaMaldivesMaliMauritaniaMauritiusMexicoMicronesia, Fed. Sts.Middle East & North AfricaMiddle East & North Africa (excluding high income)Middle East & North Africa (IDA & IBRD countries)Middle incomeMoldovaMongoliaMoroccoMozambiqueMyanmarNamibiaNepalNetherlandsNew CaledoniaNew ZealandNicaraguaNigerNigeriaNorth AmericaNorwayOECD membersOmanOther small statesPacific island small statesPakistanPanamaPapua New GuineaParaguayPeruPhilippinesPolandPortugalPost-demographic dividendPre-demographic dividendQatarRomaniaRussian FederationRwandaSamoaSao Tome and PrincipeSaudi ArabiaSenegalSeychellesSierra LeoneSingaporeSlovak RepublicSloveniaSmall statesSolomon IslandsSomaliaSouth AfricaSouth AsiaSouth Asia (IDA & IBRD)SpainSri LankaSt. LuciaSt. Vincent and the GrenadinesSub-Saharan Africa Sub-Saharan Africa (excluding high income)Sub-Saharan Africa (IDA & IBRD countries)SudanSurinameSwazilandSwedenSwitzerlandSyrian Arab RepublicTajikistanTanzaniaThailandTogoTongaTrinidad and TobagoTunisiaTurkeyTurkmenistanUgandaUkraineUnited Arab EmiratesUnited KingdomUnited StatesUpper middle incomeUruguayUzbekistanVanuatuVenezuela, RBVietnamWorldYemen, Rep.ZambiaZimbabwe Timeline:
This timeline shows a graph from 1971 to 2015 of Chile. No data until 1970. Number of actual observations by date: 45.
Source name:
World Development Indicators
Source organization:
World Bank staff estimates based on sources and methods in World Bank's "The Changing Wealth of Nations: Measuring Sustainable Development in the New Millennium" (2011).
Categories, topics:
Economy & Growth, Energy & Mining
Last updated:
apr 23, 2017
Indicators value changes by year
Maximum:
14.784
jan 1, 2007
At the date of observation
Value
Absolute change
Change from previous value
jan 1, 1971
6.072
+6.072
0.0%
jan 1, 1972
3.876
-2.196
-36.17%
jan 1, 1973
3.404
-0.472
-12.18%
jan 1, 1974
4.393
+0.989
29.06%
jan 1, 1975
6.569
+2.176
49.53%
jan 1, 1976
7.326
+0.757
11.53%
jan 1, 1977
7.51
+0.183
2.5%
jan 1, 1978
4.782
-2.728
-36.32%
jan 1, 1979
4.263
-0.519
-10.85%
jan 1, 1980
5.419
+1.156
27.12%
jan 1, 1981
5.187
-0.233
-4.29%
jan 1, 1982
3.575
-1.611
-31.07%
jan 1, 1983
4.28
+0.704
19.7%
jan 1, 1984
5.681
+1.401
32.74%
jan 1, 1985
4.998
-0.683
-12.02%
jan 1, 1986
6.234
+1.236
24.73%
jan 1, 1987
4.712
-1.522
-24.41%
jan 1, 1988
5.653
+0.94
19.96%
jan 1, 1989
7.697
+2.045
36.17%
jan 1, 1990
8.242
+0.545
7.08%
jan 1, 1991
6.596
-1.646
-19.97%
jan 1, 1992
5.378
-1.217
-18.46%
jan 1, 1993
4.381
-0.997
-18.54%
jan 1, 1994
3.208
-1.174
-26.79%
jan 1, 1995
3.524
+0.317
9.88%
jan 1, 1996
4.27
+0.746
21.17%
jan 1, 1997
3.944
-0.327
-7.65%
jan 1, 1998
4.145
+0.202
5.11%
jan 1, 1999
2.966
-1.179
-28.44%
jan 1, 2000
3.707
+0.741
24.98%
jan 1, 2001
4.823
+1.116
30.11%
jan 1, 2002
3.601
-1.222
-25.34%
jan 1, 2003
3.509
-0.092
-2.55%
jan 1, 2004
4.49
+0.981
27.94%
jan 1, 2005
7.997
+3.507
78.11%
jan 1, 2006
8.539
+0.542
6.77%
jan 1, 2007
14.784
+6.246
73.15%
jan 1, 2008
14.217
-0.567
-3.84%
jan 1, 2009
12.009
-2.207
-15.53%
jan 1, 2010
9.278
-2.731
-22.74%
jan 1, 2011
10.217
+0.939
10.12%
jan 1, 2012
10.208
-0.009
-0.09%
jan 1, 2013
9.091
-1.117
-10.95%
jan 1, 2014
8.128
-0.963
-10.59%
jan 1, 2015
7.951
-0.177
-2.18%
Ranking of countries by current statistics by years


Comments: