29
/
en
AIzaSyAYiBZKx7MnpbEhh9jyipgxe19OcubqV5w
April 1, 2024
113198
Cote d'Ivoire
CIV
true
2
1
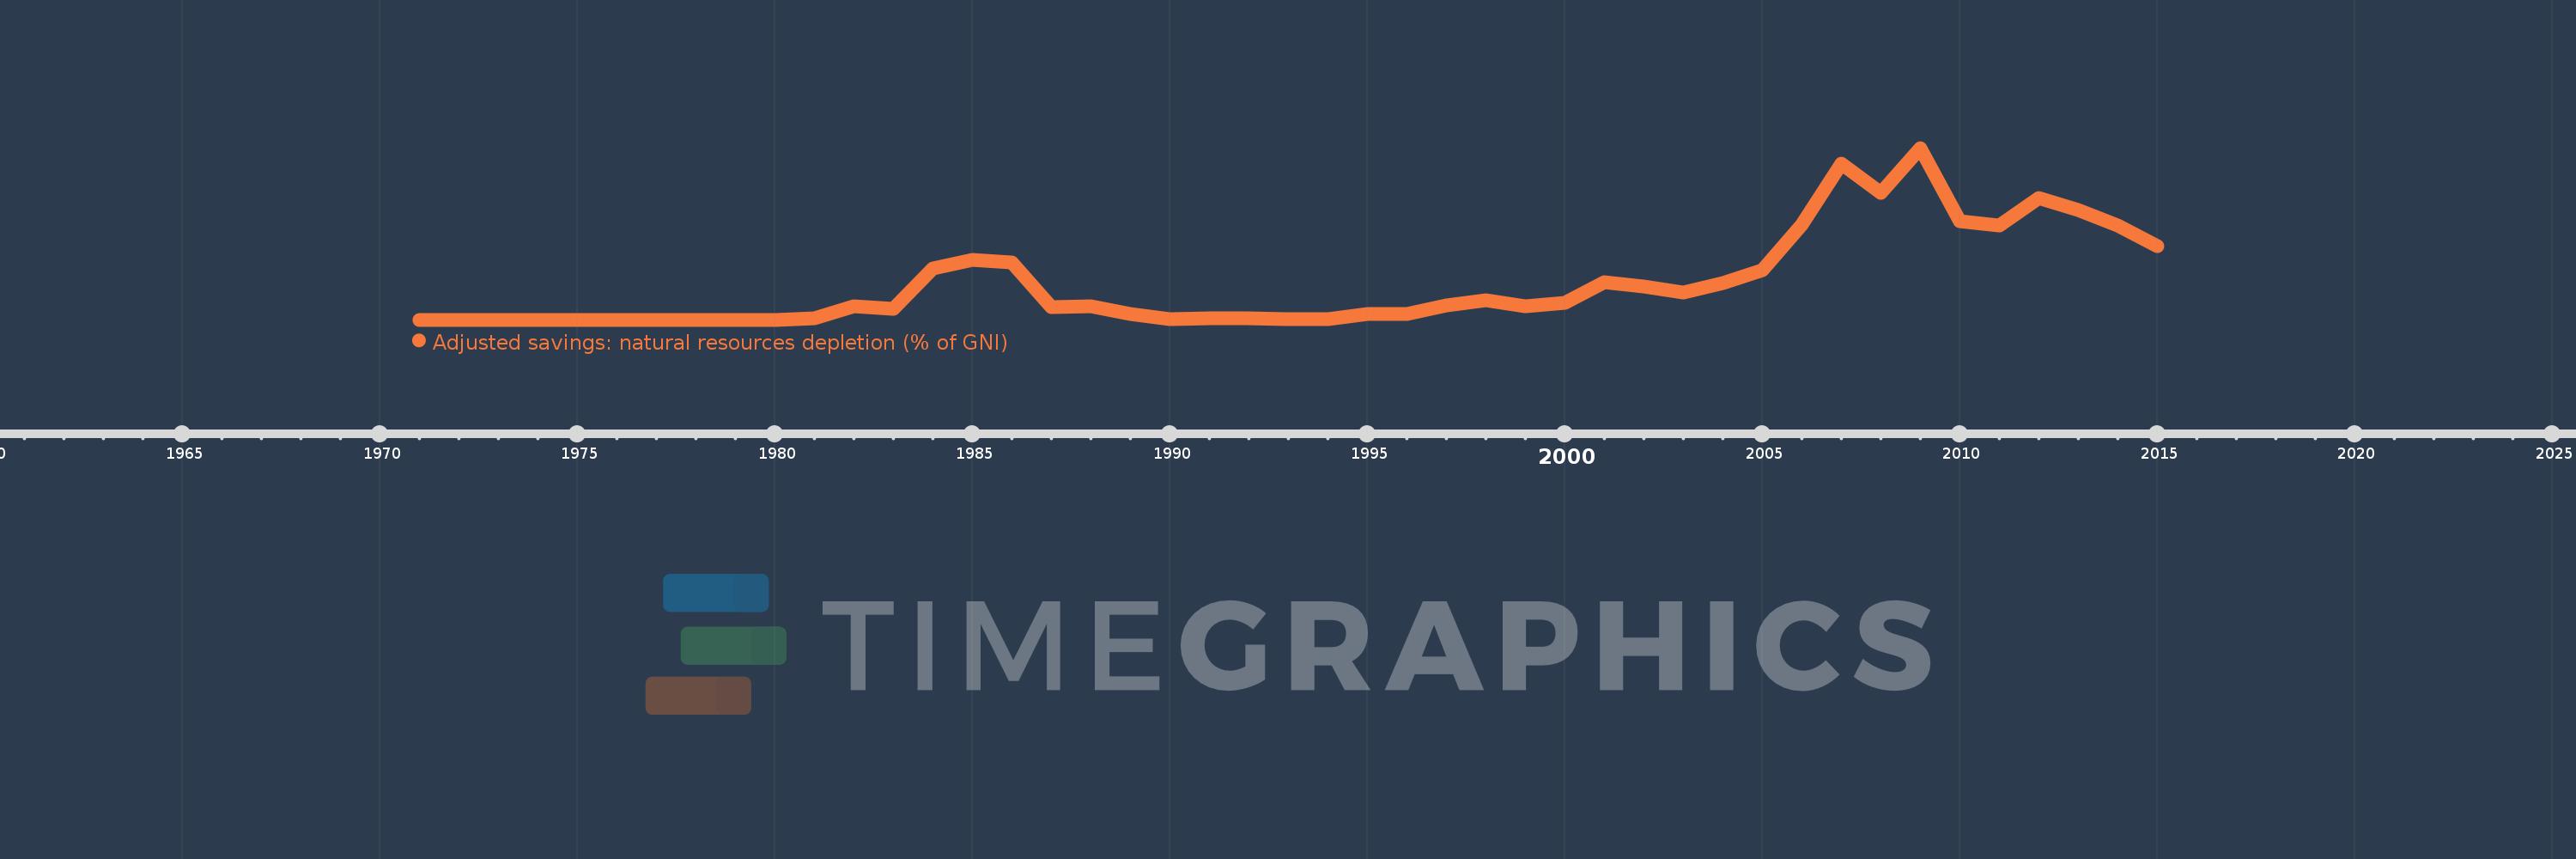
Adjusted savings: natural resources depletion (% of GNI)
2015,2014,2013,2012,2011,2010,2009,2008,2007,2006,2005,2004,2003,2002,2001,2000,1999,1998,1997,1996,1995,1994,1993,1992,1991,1990,1989,1988,1987,1986,1985,1984,1983,1982,1981,1980,1979,1978,1977,1976,1975,1974,1973,1972,1971
This statistics in other country:
AfghanistanAlbaniaAlgeriaAngolaArab WorldArgentinaArmeniaAustraliaAustriaAzerbaijanBahamas, TheBahrainBangladeshBarbadosBelarusBelgiumBelizeBeninBhutanBoliviaBotswanaBrazilBrunei DarussalamBulgariaBurkina FasoBurundiCabo VerdeCambodiaCameroonCanadaCaribbean small statesCentral African RepublicCentral Europe and the BalticsChadChileChinaColombiaComorosCongo, Dem. Rep.Congo, Rep.Costa RicaCote d'IvoireCroatiaCubaCyprusCzech RepublicDenmarkDjiboutiDominicaDominican RepublicEarly-demographic dividendEast Asia & PacificEast Asia & Pacific (excluding high income)East Asia & Pacific (IDA & IBRD countries)EcuadorEgypt, Arab Rep.El SalvadorEquatorial GuineaEritreaEstoniaEthiopiaEuro areaEurope & Central AsiaEurope & Central Asia (excluding high income)Europe & Central Asia (IDA & IBRD countries)European UnionFijiFinlandFragile and conflict affected situationsFranceFrench PolynesiaGabonGambia, TheGeorgiaGermanyGhanaGreeceGuatemalaGuineaGuinea-BissauGuyanaHaitiHeavily indebted poor countries (HIPC)High incomeHondurasHong Kong SAR, ChinaHungaryIBRD onlyIcelandIDA & IBRD totalIDA blendIDA onlyIDA totalIndiaIndonesiaIran, Islamic Rep.IraqIrelandIsraelItalyJamaicaJapanJordanKazakhstanKenyaKiribatiKorea, Rep.KuwaitKyrgyz RepublicLao PDRLate-demographic dividendLatin America & Caribbean Latin America & Caribbean (excluding high income)Latin America & the Caribbean (IDA & IBRD countries)LatviaLeast developed countries: UN classificationLebanonLesothoLiberiaLibyaLithuaniaLow & middle incomeLow incomeLower middle incomeLuxembourgMacedonia, FYRMadagascarMalawiMalaysiaMaldivesMaliMauritaniaMauritiusMexicoMicronesia, Fed. Sts.Middle East & North AfricaMiddle East & North Africa (excluding high income)Middle East & North Africa (IDA & IBRD countries)Middle incomeMoldovaMongoliaMoroccoMozambiqueMyanmarNamibiaNepalNetherlandsNew CaledoniaNew ZealandNicaraguaNigerNigeriaNorth AmericaNorwayOECD membersOmanOther small statesPacific island small statesPakistanPanamaPapua New GuineaParaguayPeruPhilippinesPolandPortugalPost-demographic dividendPre-demographic dividendQatarRomaniaRussian FederationRwandaSamoaSao Tome and PrincipeSaudi ArabiaSenegalSeychellesSierra LeoneSingaporeSlovak RepublicSloveniaSmall statesSolomon IslandsSomaliaSouth AfricaSouth AsiaSouth Asia (IDA & IBRD)SpainSri LankaSt. LuciaSt. Vincent and the GrenadinesSub-Saharan Africa Sub-Saharan Africa (excluding high income)Sub-Saharan Africa (IDA & IBRD countries)SudanSurinameSwazilandSwedenSwitzerlandSyrian Arab RepublicTajikistanTanzaniaThailandTogoTongaTrinidad and TobagoTunisiaTurkeyTurkmenistanUgandaUkraineUnited Arab EmiratesUnited KingdomUnited StatesUpper middle incomeUruguayUzbekistanVanuatuVenezuela, RBVietnamWorldYemen, Rep.ZambiaZimbabwe Timeline:
This timeline shows a graph from 1971 to 2015 of Cote d'Ivoire. No data until 1970. Number of actual observations by date: 45.
Source name:
World Development Indicators
Source organization:
World Bank staff estimates based on sources and methods in World Bank's "The Changing Wealth of Nations: Measuring Sustainable Development in the New Millennium" (2011).
Categories, topics:
Economy & Growth, Energy & Mining
Last updated:
apr 23, 2017
Indicators value changes by year
At the date of observation
Value
Absolute change
Change from previous value
jan 1, 1981
0.059
+0.059
%
jan 1, 1982
0.756
+0.697
1.17K%
jan 1, 1983
0.618
-0.138
-18.26%
jan 1, 1984
2.82
+2.202
356.31%
jan 1, 1985
3.256
+0.435
15.44%
jan 1, 1986
3.148
-0.108
-3.32%
jan 1, 1987
0.682
-2.466
-78.34%
jan 1, 1988
0.753
+0.071
10.4%
jan 1, 1989
0.333
-0.42
-55.8%
jan 1, 1990
0.056
-0.276
-83.06%
jan 1, 1991
0.07
+0.013
23.43%
jan 1, 1992
0.057
-0.012
-17.46%
jan 1, 1993
0.039
-0.019
-32.4%
jan 1, 1994
0.011
-0.027
-70.59%
jan 1, 1995
0.291
+0.28
2.45K%
jan 1, 1996
0.311
+0.019
6.61%
jan 1, 1997
0.796
+0.486
156.39%
jan 1, 1998
1.075
+0.279
35.08%
jan 1, 1999
0.717
-0.359
-33.34%
jan 1, 2000
0.93
+0.214
29.8%
jan 1, 2001
2.041
+1.11
119.34%
jan 1, 2002
1.827
-0.214
-10.5%
jan 1, 2003
1.471
-0.356
-19.47%
jan 1, 2004
2.026
+0.556
37.77%
jan 1, 2005
2.709
+0.683
33.69%
jan 1, 2006
5.192
+2.483
91.65%
jan 1, 2007
8.521
+3.329
64.11%
jan 1, 2008
6.914
-1.607
-18.86%
jan 1, 2009
9.381
+2.467
35.69%
jan 1, 2010
5.376
-4.005
-42.69%
jan 1, 2011
5.138
-0.238
-4.42%
jan 1, 2012
6.642
+1.504
29.27%
jan 1, 2013
5.997
-0.645
-9.72%
jan 1, 2014
5.153
-0.844
-14.08%
jan 1, 2015
4.001
-1.152
-22.36%
Ranking of countries by current statistics by years


Comments: