29
/
en
AIzaSyAYiBZKx7MnpbEhh9jyipgxe19OcubqV5w
April 1, 2024
23871
Arab World
ARB
false
2
1
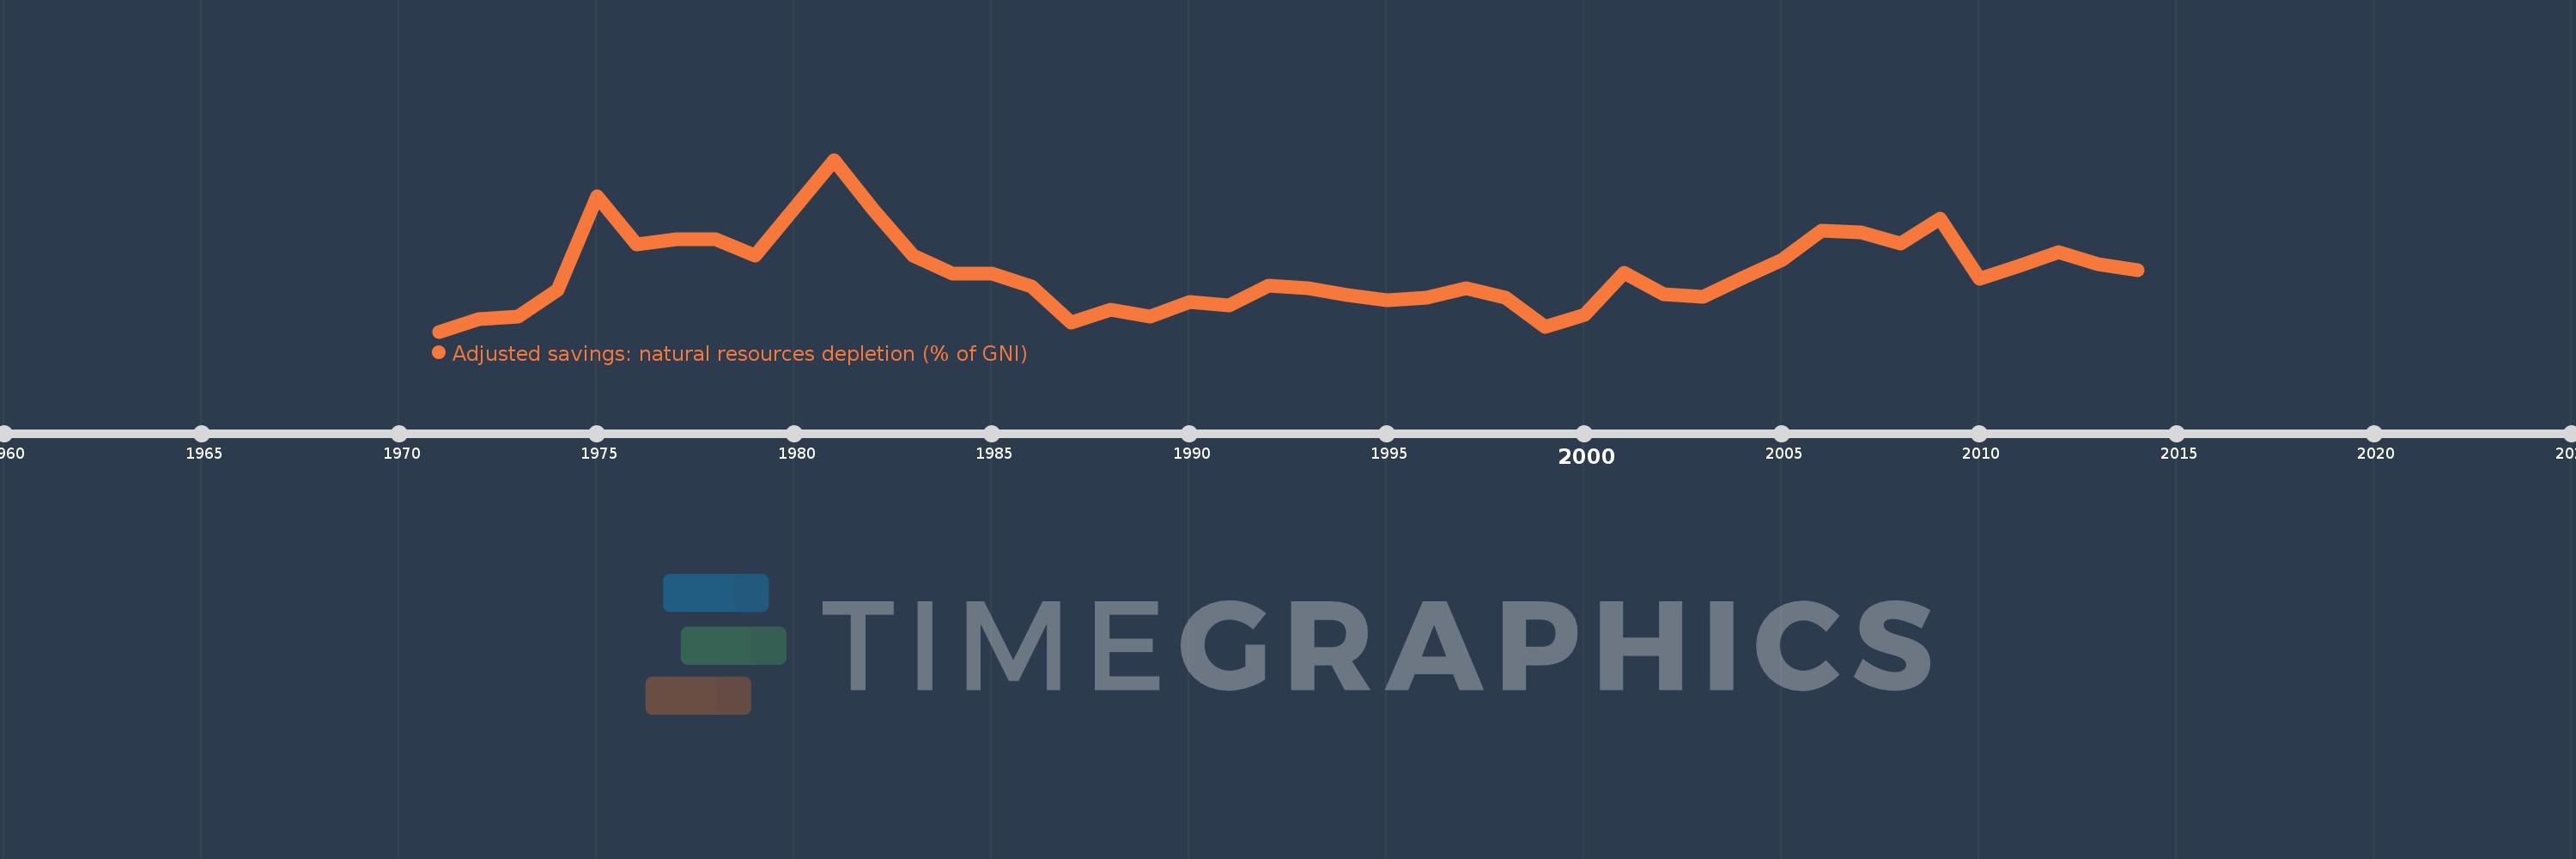
Adjusted savings: natural resources depletion (% of GNI)
2014,2013,2012,2011,2010,2009,2008,2007,2006,2005,2004,2003,2002,2001,2000,1999,1998,1997,1996,1995,1994,1993,1992,1991,1990,1989,1988,1987,1986,1985,1984,1983,1982,1981,1979,1978,1977,1976,1975,1974,1973,1972,1971
This statistics in other country:
AfghanistanAlbaniaAlgeriaAngolaArab WorldArgentinaArmeniaAustraliaAustriaAzerbaijanBahamas, TheBahrainBangladeshBarbadosBelarusBelgiumBelizeBeninBhutanBoliviaBotswanaBrazilBrunei DarussalamBulgariaBurkina FasoBurundiCabo VerdeCambodiaCameroonCanadaCaribbean small statesCentral African RepublicCentral Europe and the BalticsChadChileChinaColombiaComorosCongo, Dem. Rep.Congo, Rep.Costa RicaCote d'IvoireCroatiaCubaCyprusCzech RepublicDenmarkDjiboutiDominicaDominican RepublicEarly-demographic dividendEast Asia & PacificEast Asia & Pacific (excluding high income)East Asia & Pacific (IDA & IBRD countries)EcuadorEgypt, Arab Rep.El SalvadorEquatorial GuineaEritreaEstoniaEthiopiaEuro areaEurope & Central AsiaEurope & Central Asia (excluding high income)Europe & Central Asia (IDA & IBRD countries)European UnionFijiFinlandFragile and conflict affected situationsFranceFrench PolynesiaGabonGambia, TheGeorgiaGermanyGhanaGreeceGuatemalaGuineaGuinea-BissauGuyanaHaitiHeavily indebted poor countries (HIPC)High incomeHondurasHong Kong SAR, ChinaHungaryIBRD onlyIcelandIDA & IBRD totalIDA blendIDA onlyIDA totalIndiaIndonesiaIran, Islamic Rep.IraqIrelandIsraelItalyJamaicaJapanJordanKazakhstanKenyaKiribatiKorea, Rep.KuwaitKyrgyz RepublicLao PDRLate-demographic dividendLatin America & Caribbean Latin America & Caribbean (excluding high income)Latin America & the Caribbean (IDA & IBRD countries)LatviaLeast developed countries: UN classificationLebanonLesothoLiberiaLibyaLithuaniaLow & middle incomeLow incomeLower middle incomeLuxembourgMacedonia, FYRMadagascarMalawiMalaysiaMaldivesMaliMauritaniaMauritiusMexicoMicronesia, Fed. Sts.Middle East & North AfricaMiddle East & North Africa (excluding high income)Middle East & North Africa (IDA & IBRD countries)Middle incomeMoldovaMongoliaMoroccoMozambiqueMyanmarNamibiaNepalNetherlandsNew CaledoniaNew ZealandNicaraguaNigerNigeriaNorth AmericaNorwayOECD membersOmanOther small statesPacific island small statesPakistanPanamaPapua New GuineaParaguayPeruPhilippinesPolandPortugalPost-demographic dividendPre-demographic dividendQatarRomaniaRussian FederationRwandaSamoaSao Tome and PrincipeSaudi ArabiaSenegalSeychellesSierra LeoneSingaporeSlovak RepublicSloveniaSmall statesSolomon IslandsSomaliaSouth AfricaSouth AsiaSouth Asia (IDA & IBRD)SpainSri LankaSt. LuciaSt. Vincent and the GrenadinesSub-Saharan Africa Sub-Saharan Africa (excluding high income)Sub-Saharan Africa (IDA & IBRD countries)SudanSurinameSwazilandSwedenSwitzerlandSyrian Arab RepublicTajikistanTanzaniaThailandTogoTongaTrinidad and TobagoTunisiaTurkeyTurkmenistanUgandaUkraineUnited Arab EmiratesUnited KingdomUnited StatesUpper middle incomeUruguayUzbekistanVanuatuVenezuela, RBVietnamWorldYemen, Rep.ZambiaZimbabwe Timeline:
This timeline shows a graph from 1971 to 2014 of Arab World. No data until 1970. Number of actual observations by date: 43.
Source name:
World Development Indicators
Source organization:
World Bank staff estimates based on sources and methods in World Bank's "The Changing Wealth of Nations: Measuring Sustainable Development in the New Millennium" (2011).
Categories, topics:
Economy & Growth, Energy & Mining
Last updated:
apr 23, 2017
Indicators value changes by year
Maximum:
31.613
jan 1, 1981
At the date of observation
Value
Absolute change
Change from previous value
jan 1, 1971
7.097
+7.097
0.0%
jan 1, 1972
8.853
+1.756
24.75%
jan 1, 1973
9.218
+0.366
4.13%
jan 1, 1974
13.068
+3.849
41.76%
jan 1, 1975
26.354
+13.287
101.68%
jan 1, 1976
19.489
-6.865
-26.05%
jan 1, 1977
20.285
+0.796
4.08%
jan 1, 1978
20.236
-0.049
-0.24%
jan 1, 1979
17.978
-2.257
-11.15%
jan 1, 1981
31.613
+13.635
75.84%
jan 1, 1982
24.485
-7.128
-22.55%
jan 1, 1983
17.889
-6.596
-26.94%
jan 1, 1984
15.334
-2.556
-14.29%
jan 1, 1985
15.409
+0.075
0.49%
jan 1, 1986
13.528
-1.881
-12.21%
jan 1, 1987
8.406
-5.122
-37.86%
jan 1, 1988
10.192
+1.786
21.25%
jan 1, 1989
9.287
-0.906
-8.89%
jan 1, 1990
11.28
+1.994
21.47%
jan 1, 1991
10.878
-0.403
-3.57%
jan 1, 1992
13.619
+2.741
25.2%
jan 1, 1993
13.302
-0.318
-2.33%
jan 1, 1994
12.329
-0.973
-7.31%
jan 1, 1995
11.632
-0.697
-5.66%
jan 1, 1996
11.887
+0.256
2.2%
jan 1, 1997
13.256
+1.369
11.52%
jan 1, 1998
11.988
-1.269
-9.57%
jan 1, 1999
7.788
-4.199
-35.03%
jan 1, 2000
9.459
+1.671
21.45%
jan 1, 2001
15.465
+6.006
63.5%
jan 1, 2002
12.464
-3.001
-19.4%
jan 1, 2003
12.077
-0.387
-3.11%
jan 1, 2004
14.697
+2.619
21.69%
jan 1, 2005
17.332
+2.635
17.93%
jan 1, 2006
21.484
+4.152
23.96%
jan 1, 2007
21.267
-0.217
-1.01%
jan 1, 2008
19.71
-1.558
-7.32%
jan 1, 2009
23.185
+3.475
17.63%
jan 1, 2010
14.595
-8.589
-37.05%
jan 1, 2011
16.415
+1.82
12.47%
jan 1, 2012
18.424
+2.008
12.23%
jan 1, 2013
16.776
-1.647
-8.94%
jan 1, 2014
15.822
-0.954
-5.69%
Ranking of countries by current statistics by years


Comments: