29
/
en
AIzaSyAYiBZKx7MnpbEhh9jyipgxe19OcubqV5w
April 1, 2024
27051
East Asia & Pacific
EAS
false
2
1
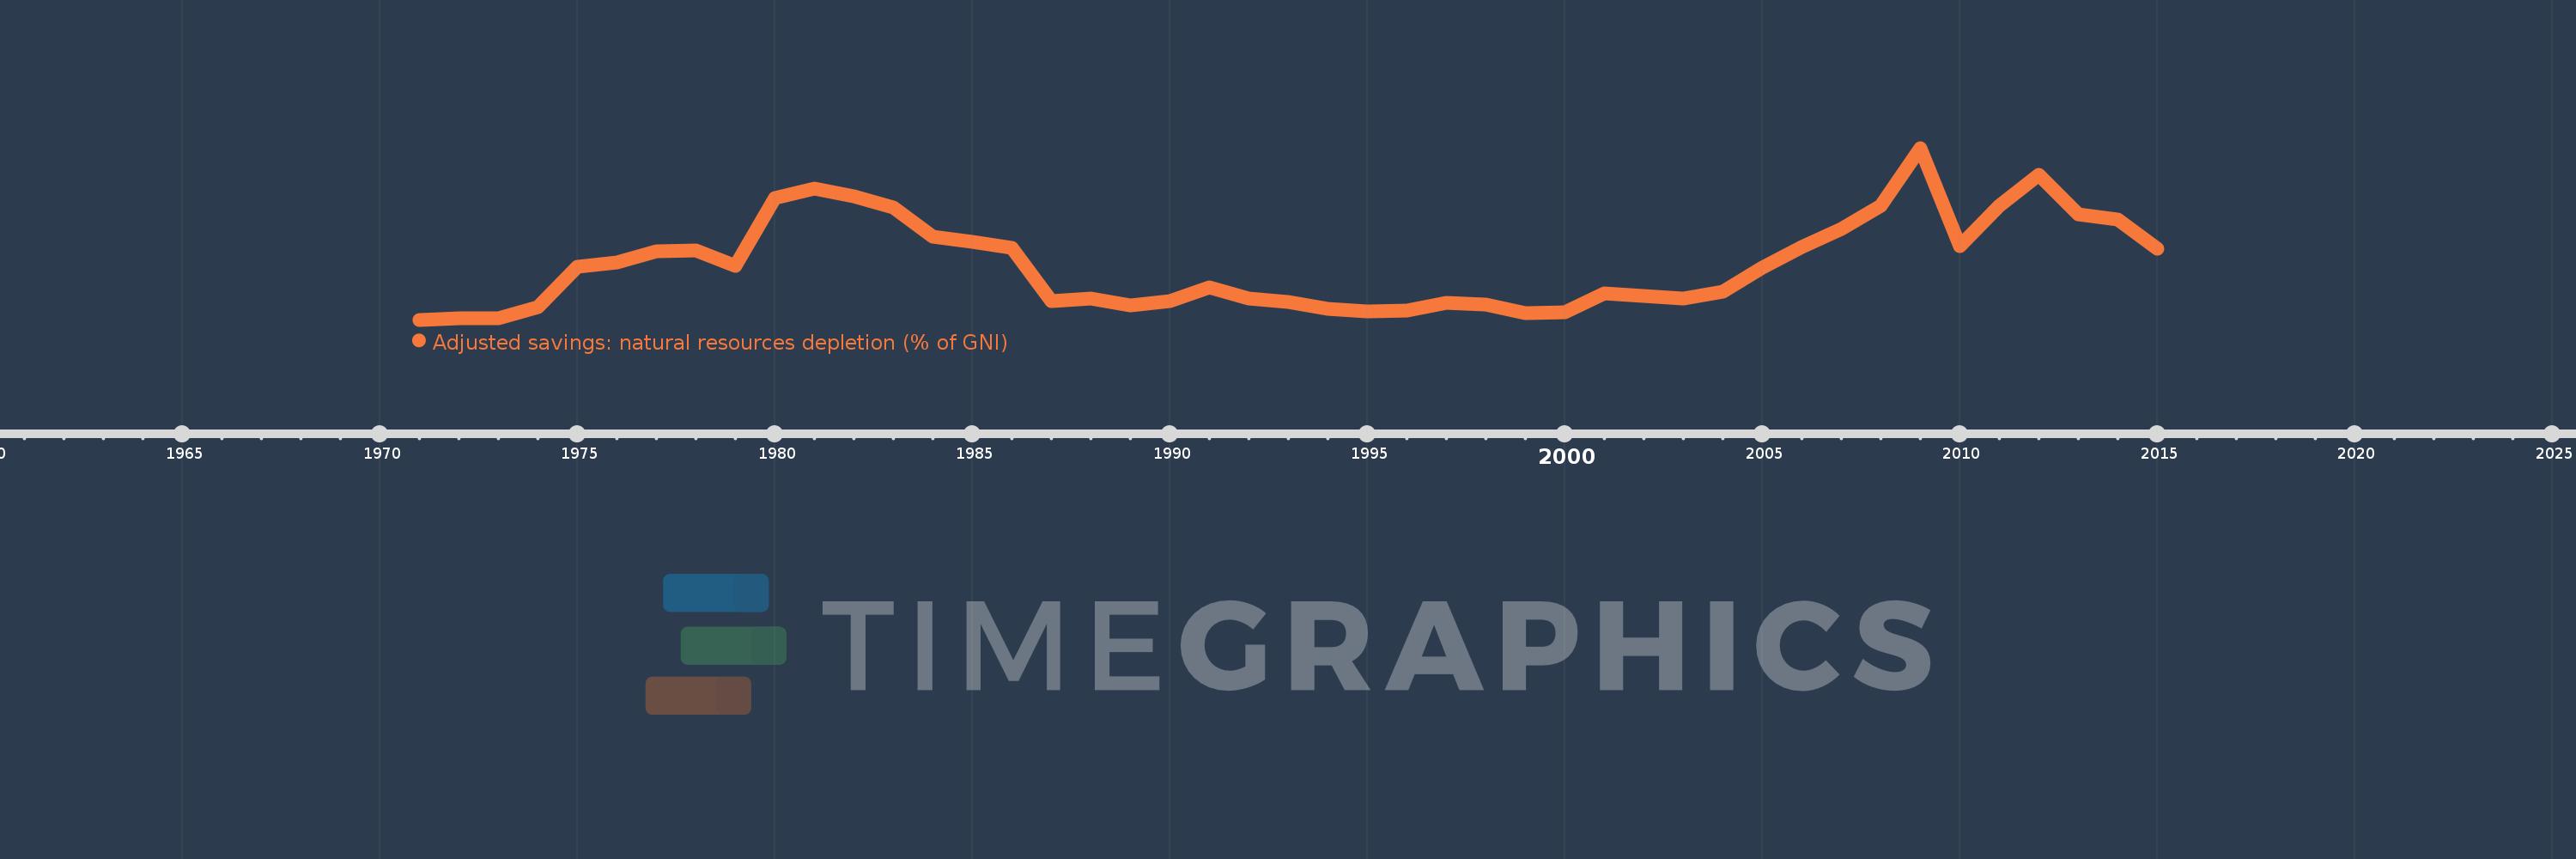
Adjusted savings: natural resources depletion (% of GNI)
2015,2014,2013,2012,2011,2010,2009,2008,2007,2006,2005,2004,2003,2002,2001,2000,1999,1998,1997,1996,1995,1994,1993,1992,1991,1990,1989,1988,1987,1986,1985,1984,1983,1982,1981,1980,1979,1978,1977,1976,1975,1974,1973,1972,1971
This statistics in other country:
AfghanistanAlbaniaAlgeriaAngolaArab WorldArgentinaArmeniaAustraliaAustriaAzerbaijanBahamas, TheBahrainBangladeshBarbadosBelarusBelgiumBelizeBeninBhutanBoliviaBotswanaBrazilBrunei DarussalamBulgariaBurkina FasoBurundiCabo VerdeCambodiaCameroonCanadaCaribbean small statesCentral African RepublicCentral Europe and the BalticsChadChileChinaColombiaComorosCongo, Dem. Rep.Congo, Rep.Costa RicaCote d'IvoireCroatiaCubaCyprusCzech RepublicDenmarkDjiboutiDominicaDominican RepublicEarly-demographic dividendEast Asia & PacificEast Asia & Pacific (excluding high income)East Asia & Pacific (IDA & IBRD countries)EcuadorEgypt, Arab Rep.El SalvadorEquatorial GuineaEritreaEstoniaEthiopiaEuro areaEurope & Central AsiaEurope & Central Asia (excluding high income)Europe & Central Asia (IDA & IBRD countries)European UnionFijiFinlandFragile and conflict affected situationsFranceFrench PolynesiaGabonGambia, TheGeorgiaGermanyGhanaGreeceGuatemalaGuineaGuinea-BissauGuyanaHaitiHeavily indebted poor countries (HIPC)High incomeHondurasHong Kong SAR, ChinaHungaryIBRD onlyIcelandIDA & IBRD totalIDA blendIDA onlyIDA totalIndiaIndonesiaIran, Islamic Rep.IraqIrelandIsraelItalyJamaicaJapanJordanKazakhstanKenyaKiribatiKorea, Rep.KuwaitKyrgyz RepublicLao PDRLate-demographic dividendLatin America & Caribbean Latin America & Caribbean (excluding high income)Latin America & the Caribbean (IDA & IBRD countries)LatviaLeast developed countries: UN classificationLebanonLesothoLiberiaLibyaLithuaniaLow & middle incomeLow incomeLower middle incomeLuxembourgMacedonia, FYRMadagascarMalawiMalaysiaMaldivesMaliMauritaniaMauritiusMexicoMicronesia, Fed. Sts.Middle East & North AfricaMiddle East & North Africa (excluding high income)Middle East & North Africa (IDA & IBRD countries)Middle incomeMoldovaMongoliaMoroccoMozambiqueMyanmarNamibiaNepalNetherlandsNew CaledoniaNew ZealandNicaraguaNigerNigeriaNorth AmericaNorwayOECD membersOmanOther small statesPacific island small statesPakistanPanamaPapua New GuineaParaguayPeruPhilippinesPolandPortugalPost-demographic dividendPre-demographic dividendQatarRomaniaRussian FederationRwandaSamoaSao Tome and PrincipeSaudi ArabiaSenegalSeychellesSierra LeoneSingaporeSlovak RepublicSloveniaSmall statesSolomon IslandsSomaliaSouth AfricaSouth AsiaSouth Asia (IDA & IBRD)SpainSri LankaSt. LuciaSt. Vincent and the GrenadinesSub-Saharan Africa Sub-Saharan Africa (excluding high income)Sub-Saharan Africa (IDA & IBRD countries)SudanSurinameSwazilandSwedenSwitzerlandSyrian Arab RepublicTajikistanTanzaniaThailandTogoTongaTrinidad and TobagoTunisiaTurkeyTurkmenistanUgandaUkraineUnited Arab EmiratesUnited KingdomUnited StatesUpper middle incomeUruguayUzbekistanVanuatuVenezuela, RBVietnamWorldYemen, Rep.ZambiaZimbabwe Timeline:
This timeline shows a graph from 1971 to 2015 of East Asia & Pacific. No data until 1970. Number of actual observations by date: 45.
Source name:
World Development Indicators
Source organization:
World Bank staff estimates based on sources and methods in World Bank's "The Changing Wealth of Nations: Measuring Sustainable Development in the New Millennium" (2011).
Categories, topics:
Economy & Growth, Energy & Mining
Last updated:
apr 23, 2017
Indicators value changes by year
At the date of observation
Value
Absolute change
Change from previous value
jan 1, 1971
0.319
+0.319
0.0%
jan 1, 1972
0.343
+0.024
7.5%
jan 1, 1973
0.351
+0.009
2.53%
jan 1, 1974
0.582
+0.231
65.8%
jan 1, 1975
1.405
+0.823
141.29%
jan 1, 1976
1.494
+0.089
6.32%
jan 1, 1977
1.722
+0.228
15.27%
jan 1, 1978
1.734
+0.012
0.68%
jan 1, 1979
1.423
-0.31
-17.91%
jan 1, 1980
2.804
+1.38
96.99%
jan 1, 1981
2.992
+0.188
6.72%
jan 1, 1982
2.831
-0.161
-5.37%
jan 1, 1983
2.607
-0.224
-7.92%
jan 1, 1984
2.013
-0.594
-22.8%
jan 1, 1985
1.91
-0.102
-5.09%
jan 1, 1986
1.79
-0.12
-6.29%
jan 1, 1987
0.702
-1.088
-60.78%
jan 1, 1988
0.757
+0.055
7.86%
jan 1, 1989
0.609
-0.149
-19.62%
jan 1, 1990
0.703
+0.094
15.45%
jan 1, 1991
0.977
+0.274
38.98%
jan 1, 1992
0.754
-0.223
-22.83%
jan 1, 1993
0.673
-0.081
-10.75%
jan 1, 1994
0.54
-0.132
-19.66%
jan 1, 1995
0.49
-0.05
-9.31%
jan 1, 1996
0.508
+0.018
3.76%
jan 1, 1997
0.657
+0.149
29.27%
jan 1, 1998
0.627
-0.03
-4.57%
jan 1, 1999
0.452
-0.175
-27.89%
jan 1, 2000
0.472
+0.02
4.32%
jan 1, 2001
0.854
+0.382
80.98%
jan 1, 2002
0.8
-0.054
-6.34%
jan 1, 2003
0.743
-0.057
-7.08%
jan 1, 2004
0.887
+0.144
19.38%
jan 1, 2005
1.385
+0.498
56.17%
jan 1, 2006
1.806
+0.421
30.36%
jan 1, 2007
2.174
+0.369
20.41%
jan 1, 2008
2.641
+0.467
21.47%
jan 1, 2009
3.823
+1.182
44.74%
jan 1, 2010
1.814
-2.009
-52.56%
jan 1, 2011
2.647
+0.833
45.94%
jan 1, 2012
3.281
+0.634
23.97%
jan 1, 2013
2.474
-0.807
-24.6%
jan 1, 2014
2.364
-0.11
-4.44%
jan 1, 2015
1.765
-0.599
-25.33%
Ranking of countries by current statistics by years


Comments: