29
/
en
AIzaSyAYiBZKx7MnpbEhh9jyipgxe19OcubqV5w
April 1, 2024
155547
Indonesia
IDN
true
2
1
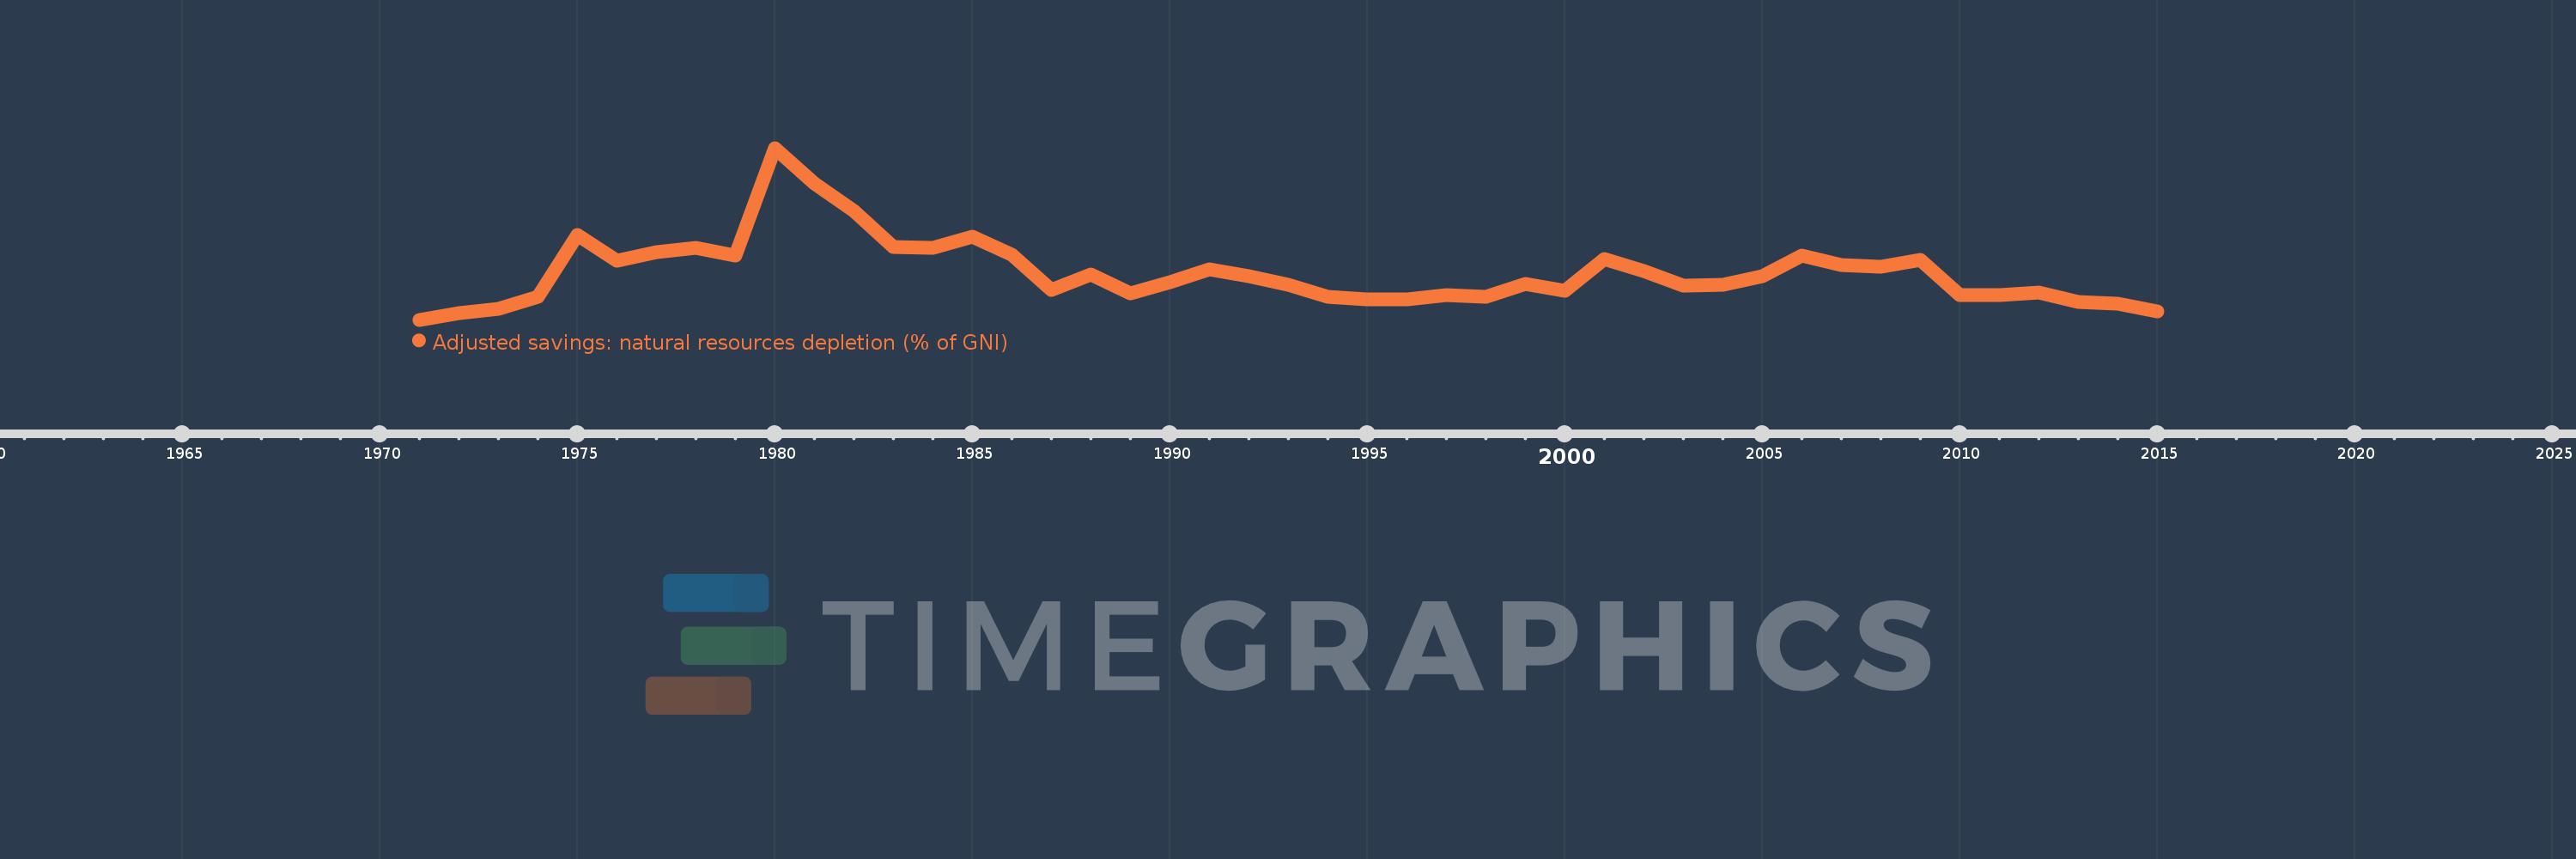
Adjusted savings: natural resources depletion (% of GNI)
2015,2014,2013,2012,2011,2010,2009,2008,2007,2006,2005,2004,2003,2002,2001,2000,1999,1998,1997,1996,1995,1994,1993,1992,1991,1990,1989,1988,1987,1986,1985,1984,1983,1982,1981,1980,1979,1978,1977,1976,1975,1974,1973,1972,1971
This statistics in other country:
AfghanistanAlbaniaAlgeriaAngolaArab WorldArgentinaArmeniaAustraliaAustriaAzerbaijanBahamas, TheBahrainBangladeshBarbadosBelarusBelgiumBelizeBeninBhutanBoliviaBotswanaBrazilBrunei DarussalamBulgariaBurkina FasoBurundiCabo VerdeCambodiaCameroonCanadaCaribbean small statesCentral African RepublicCentral Europe and the BalticsChadChileChinaColombiaComorosCongo, Dem. Rep.Congo, Rep.Costa RicaCote d'IvoireCroatiaCubaCyprusCzech RepublicDenmarkDjiboutiDominicaDominican RepublicEarly-demographic dividendEast Asia & PacificEast Asia & Pacific (excluding high income)East Asia & Pacific (IDA & IBRD countries)EcuadorEgypt, Arab Rep.El SalvadorEquatorial GuineaEritreaEstoniaEthiopiaEuro areaEurope & Central AsiaEurope & Central Asia (excluding high income)Europe & Central Asia (IDA & IBRD countries)European UnionFijiFinlandFragile and conflict affected situationsFranceFrench PolynesiaGabonGambia, TheGeorgiaGermanyGhanaGreeceGuatemalaGuineaGuinea-BissauGuyanaHaitiHeavily indebted poor countries (HIPC)High incomeHondurasHong Kong SAR, ChinaHungaryIBRD onlyIcelandIDA & IBRD totalIDA blendIDA onlyIDA totalIndiaIndonesiaIran, Islamic Rep.IraqIrelandIsraelItalyJamaicaJapanJordanKazakhstanKenyaKiribatiKorea, Rep.KuwaitKyrgyz RepublicLao PDRLate-demographic dividendLatin America & Caribbean Latin America & Caribbean (excluding high income)Latin America & the Caribbean (IDA & IBRD countries)LatviaLeast developed countries: UN classificationLebanonLesothoLiberiaLibyaLithuaniaLow & middle incomeLow incomeLower middle incomeLuxembourgMacedonia, FYRMadagascarMalawiMalaysiaMaldivesMaliMauritaniaMauritiusMexicoMicronesia, Fed. Sts.Middle East & North AfricaMiddle East & North Africa (excluding high income)Middle East & North Africa (IDA & IBRD countries)Middle incomeMoldovaMongoliaMoroccoMozambiqueMyanmarNamibiaNepalNetherlandsNew CaledoniaNew ZealandNicaraguaNigerNigeriaNorth AmericaNorwayOECD membersOmanOther small statesPacific island small statesPakistanPanamaPapua New GuineaParaguayPeruPhilippinesPolandPortugalPost-demographic dividendPre-demographic dividendQatarRomaniaRussian FederationRwandaSamoaSao Tome and PrincipeSaudi ArabiaSenegalSeychellesSierra LeoneSingaporeSlovak RepublicSloveniaSmall statesSolomon IslandsSomaliaSouth AfricaSouth AsiaSouth Asia (IDA & IBRD)SpainSri LankaSt. LuciaSt. Vincent and the GrenadinesSub-Saharan Africa Sub-Saharan Africa (excluding high income)Sub-Saharan Africa (IDA & IBRD countries)SudanSurinameSwazilandSwedenSwitzerlandSyrian Arab RepublicTajikistanTanzaniaThailandTogoTongaTrinidad and TobagoTunisiaTurkeyTurkmenistanUgandaUkraineUnited Arab EmiratesUnited KingdomUnited StatesUpper middle incomeUruguayUzbekistanVanuatuVenezuela, RBVietnamWorldYemen, Rep.ZambiaZimbabwe Timeline:
This timeline shows a graph from 1971 to 2015 of Indonesia. No data until 1970. Number of actual observations by date: 45.
Source name:
World Development Indicators
Source organization:
World Bank staff estimates based on sources and methods in World Bank's "The Changing Wealth of Nations: Measuring Sustainable Development in the New Millennium" (2011).
Categories, topics:
Economy & Growth, Energy & Mining
Last updated:
apr 23, 2017
Indicators value changes by year
Maximum:
24.138
jan 1, 1980
At the date of observation
Value
Absolute change
Change from previous value
jan 1, 1971
1.568
+1.568
0.0%
jan 1, 1972
2.432
+0.865
55.14%
jan 1, 1973
3.004
+0.572
23.51%
jan 1, 1974
4.612
+1.608
53.51%
jan 1, 1975
12.653
+8.041
174.36%
jan 1, 1976
9.282
-3.372
-26.65%
jan 1, 1977
10.439
+1.158
12.47%
jan 1, 1978
10.993
+0.554
5.31%
jan 1, 1979
10.031
-0.962
-8.75%
jan 1, 1980
24.138
+14.107
140.64%
jan 1, 1981
19.496
-4.642
-19.23%
jan 1, 1982
15.845
-3.651
-18.73%
jan 1, 1983
11.084
-4.761
-30.05%
jan 1, 1984
11.042
-0.042
-0.37%
jan 1, 1985
12.51
+1.467
13.29%
jan 1, 1986
10.091
-2.419
-19.33%
jan 1, 1987
5.447
-4.644
-46.02%
jan 1, 1988
7.544
+2.097
38.5%
jan 1, 1989
5.024
-2.52
-33.4%
jan 1, 1990
6.513
+1.488
29.62%
jan 1, 1991
8.174
+1.662
25.51%
jan 1, 1992
7.325
-0.85
-10.39%
jan 1, 1993
6.127
-1.198
-16.36%
jan 1, 1994
4.634
-1.492
-24.36%
jan 1, 1995
4.219
-0.415
-8.96%
jan 1, 1996
4.274
+0.055
1.3%
jan 1, 1997
4.827
+0.553
12.93%
jan 1, 1998
4.579
-0.248
-5.13%
jan 1, 1999
6.294
+1.715
37.47%
jan 1, 2000
5.315
-0.98
-15.56%
jan 1, 2001
9.555
+4.241
79.79%
jan 1, 2002
7.969
-1.586
-16.6%
jan 1, 2003
6.06
-1.909
-23.95%
jan 1, 2004
6.156
+0.096
1.58%
jan 1, 2005
7.3
+1.144
18.59%
jan 1, 2006
9.995
+2.695
36.92%
jan 1, 2007
8.73
-1.265
-12.66%
jan 1, 2008
8.51
-0.221
-2.53%
jan 1, 2009
9.486
+0.976
11.47%
jan 1, 2010
4.838
-4.648
-49.0%
jan 1, 2011
4.779
-0.059
-1.22%
jan 1, 2012
5.17
+0.391
8.18%
jan 1, 2013
3.895
-1.274
-24.65%
jan 1, 2014
3.65
-0.246
-6.31%
jan 1, 2015
2.629
-1.021
-27.96%
Ranking of countries by current statistics by years


Comments: