29
/
en
AIzaSyAYiBZKx7MnpbEhh9jyipgxe19OcubqV5w
April 1, 2024
223136
Philippines
PHL
true
2
1
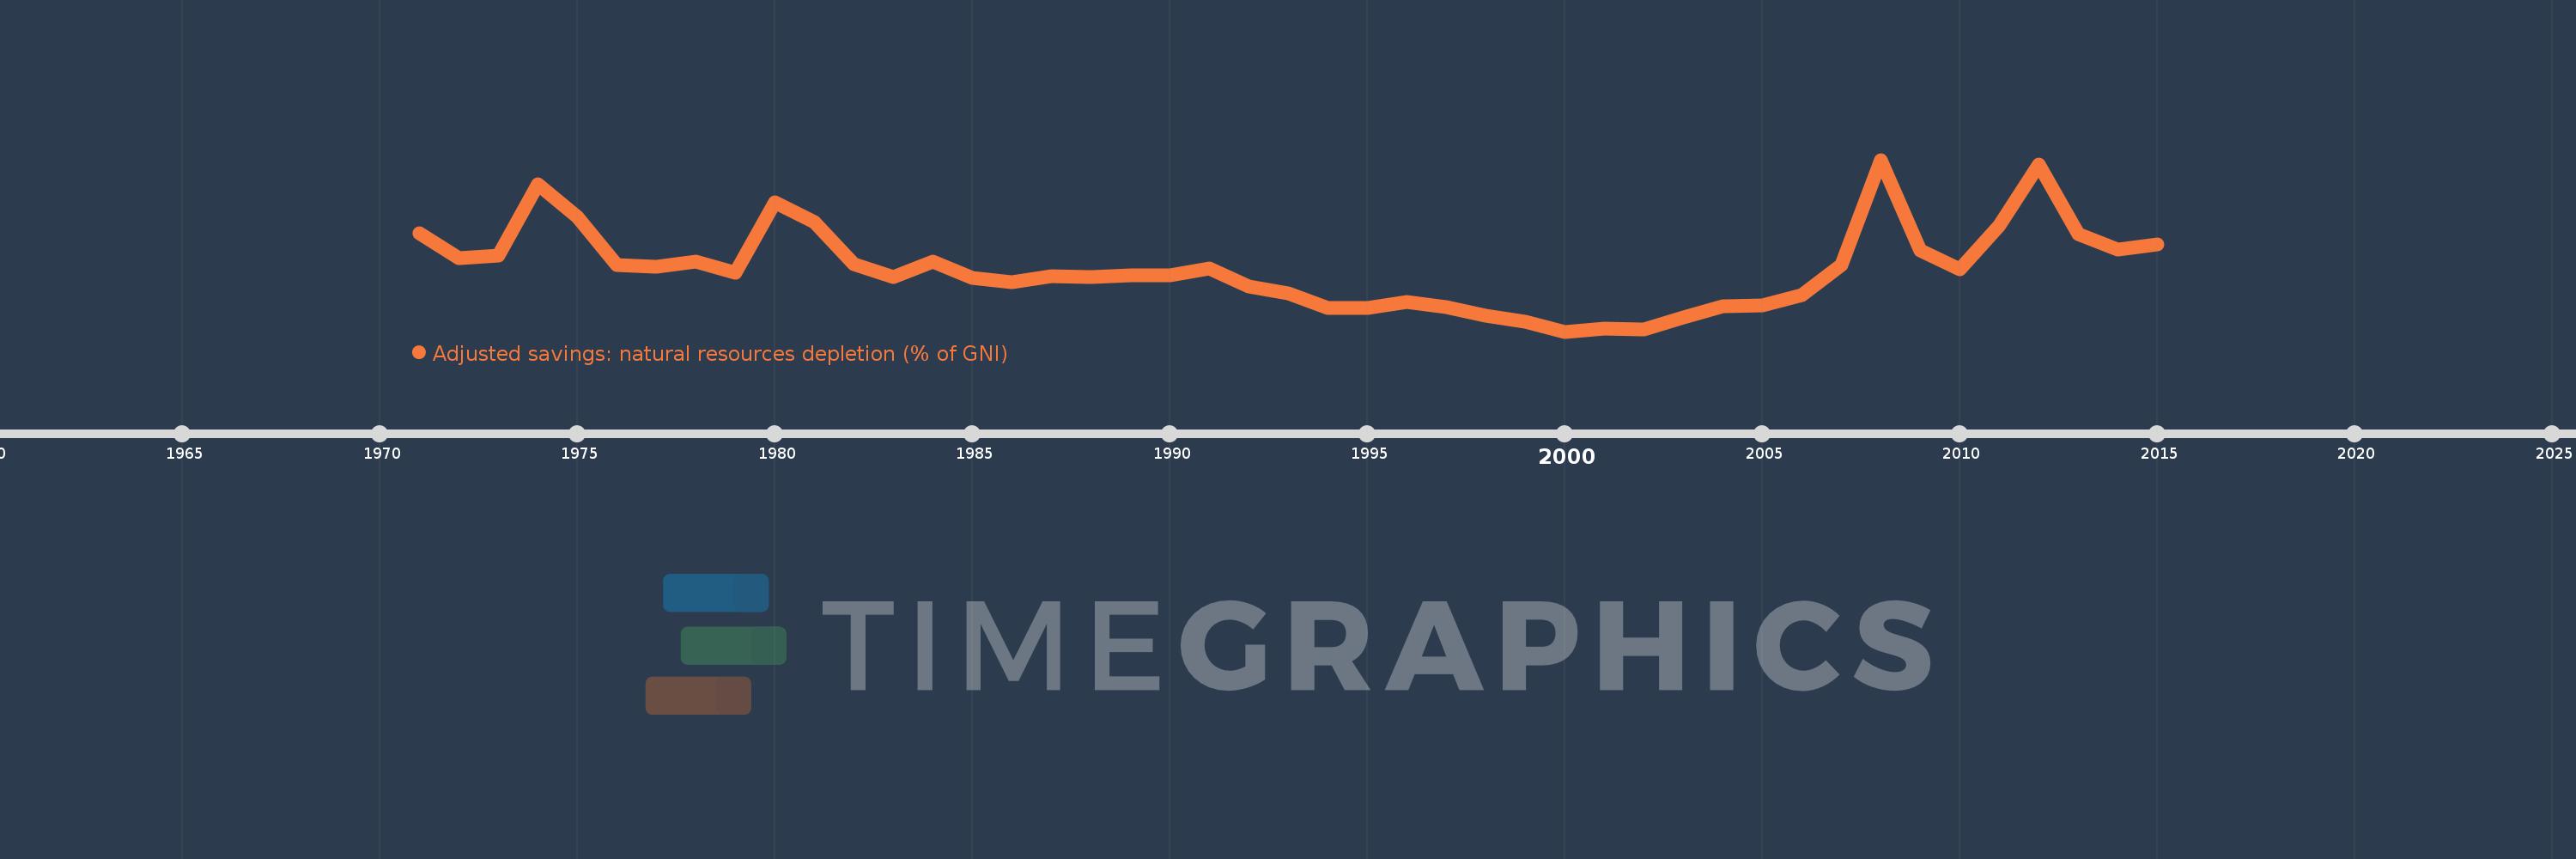
Adjusted savings: natural resources depletion (% of GNI)
2015,2014,2013,2012,2011,2010,2009,2008,2007,2006,2005,2004,2003,2002,2001,2000,1999,1998,1997,1996,1995,1994,1993,1992,1991,1990,1989,1988,1987,1986,1985,1984,1983,1982,1981,1980,1979,1978,1977,1976,1975,1974,1973,1972,1971
This statistics in other country:
AfghanistanAlbaniaAlgeriaAngolaArab WorldArgentinaArmeniaAustraliaAustriaAzerbaijanBahamas, TheBahrainBangladeshBarbadosBelarusBelgiumBelizeBeninBhutanBoliviaBotswanaBrazilBrunei DarussalamBulgariaBurkina FasoBurundiCabo VerdeCambodiaCameroonCanadaCaribbean small statesCentral African RepublicCentral Europe and the BalticsChadChileChinaColombiaComorosCongo, Dem. Rep.Congo, Rep.Costa RicaCote d'IvoireCroatiaCubaCyprusCzech RepublicDenmarkDjiboutiDominicaDominican RepublicEarly-demographic dividendEast Asia & PacificEast Asia & Pacific (excluding high income)East Asia & Pacific (IDA & IBRD countries)EcuadorEgypt, Arab Rep.El SalvadorEquatorial GuineaEritreaEstoniaEthiopiaEuro areaEurope & Central AsiaEurope & Central Asia (excluding high income)Europe & Central Asia (IDA & IBRD countries)European UnionFijiFinlandFragile and conflict affected situationsFranceFrench PolynesiaGabonGambia, TheGeorgiaGermanyGhanaGreeceGuatemalaGuineaGuinea-BissauGuyanaHaitiHeavily indebted poor countries (HIPC)High incomeHondurasHong Kong SAR, ChinaHungaryIBRD onlyIcelandIDA & IBRD totalIDA blendIDA onlyIDA totalIndiaIndonesiaIran, Islamic Rep.IraqIrelandIsraelItalyJamaicaJapanJordanKazakhstanKenyaKiribatiKorea, Rep.KuwaitKyrgyz RepublicLao PDRLate-demographic dividendLatin America & Caribbean Latin America & Caribbean (excluding high income)Latin America & the Caribbean (IDA & IBRD countries)LatviaLeast developed countries: UN classificationLebanonLesothoLiberiaLibyaLithuaniaLow & middle incomeLow incomeLower middle incomeLuxembourgMacedonia, FYRMadagascarMalawiMalaysiaMaldivesMaliMauritaniaMauritiusMexicoMicronesia, Fed. Sts.Middle East & North AfricaMiddle East & North Africa (excluding high income)Middle East & North Africa (IDA & IBRD countries)Middle incomeMoldovaMongoliaMoroccoMozambiqueMyanmarNamibiaNepalNetherlandsNew CaledoniaNew ZealandNicaraguaNigerNigeriaNorth AmericaNorwayOECD membersOmanOther small statesPacific island small statesPakistanPanamaPapua New GuineaParaguayPeruPhilippinesPolandPortugalPost-demographic dividendPre-demographic dividendQatarRomaniaRussian FederationRwandaSamoaSao Tome and PrincipeSaudi ArabiaSenegalSeychellesSierra LeoneSingaporeSlovak RepublicSloveniaSmall statesSolomon IslandsSomaliaSouth AfricaSouth AsiaSouth Asia (IDA & IBRD)SpainSri LankaSt. LuciaSt. Vincent and the GrenadinesSub-Saharan Africa Sub-Saharan Africa (excluding high income)Sub-Saharan Africa (IDA & IBRD countries)SudanSurinameSwazilandSwedenSwitzerlandSyrian Arab RepublicTajikistanTanzaniaThailandTogoTongaTrinidad and TobagoTunisiaTurkeyTurkmenistanUgandaUkraineUnited Arab EmiratesUnited KingdomUnited StatesUpper middle incomeUruguayUzbekistanVanuatuVenezuela, RBVietnamWorldYemen, Rep.ZambiaZimbabwe Timeline:
This timeline shows a graph from 1971 to 2015 of Philippines. No data until 1970. Number of actual observations by date: 45.
Source name:
World Development Indicators
Source organization:
World Bank staff estimates based on sources and methods in World Bank's "The Changing Wealth of Nations: Measuring Sustainable Development in the New Millennium" (2011).
Categories, topics:
Economy & Growth, Energy & Mining
Last updated:
apr 23, 2017
Indicators value changes by year
At the date of observation
Value
Absolute change
Change from previous value
jan 1, 1971
1.894
+1.894
0.0%
jan 1, 1972
1.49
-0.404
-21.34%
jan 1, 1973
1.531
+0.041
2.76%
jan 1, 1974
2.698
+1.167
76.2%
jan 1, 1975
2.169
-0.529
-19.6%
jan 1, 1976
1.372
-0.797
-36.75%
jan 1, 1977
1.348
-0.024
-1.75%
jan 1, 1978
1.432
+0.084
6.26%
jan 1, 1979
1.244
-0.189
-13.17%
jan 1, 1980
2.402
+1.158
93.15%
jan 1, 1981
2.083
-0.319
-13.28%
jan 1, 1982
1.384
-0.699
-33.55%
jan 1, 1983
1.174
-0.21
-15.16%
jan 1, 1984
1.428
+0.254
21.59%
jan 1, 1985
1.164
-0.264
-18.46%
jan 1, 1986
1.087
-0.077
-6.61%
jan 1, 1987
1.186
+0.099
9.07%
jan 1, 1988
1.181
-0.005
-0.39%
jan 1, 1989
1.21
+0.029
2.48%
jan 1, 1990
1.201
-0.01
-0.8%
jan 1, 1991
1.316
+0.115
9.56%
jan 1, 1992
1.028
-0.288
-21.89%
jan 1, 1993
0.914
-0.114
-11.05%
jan 1, 1994
0.666
-0.248
-27.16%
jan 1, 1995
0.667
+0.002
0.25%
jan 1, 1996
0.776
+0.109
16.33%
jan 1, 1997
0.681
-0.095
-12.28%
jan 1, 1998
0.544
-0.137
-20.12%
jan 1, 1999
0.451
-0.093
-17.03%
jan 1, 2000
0.282
-0.169
-37.52%
jan 1, 2001
0.332
+0.05
17.68%
jan 1, 2002
0.316
-0.016
-4.84%
jan 1, 2003
0.51
+0.194
61.48%
jan 1, 2004
0.701
+0.191
37.37%
jan 1, 2005
0.717
+0.017
2.4%
jan 1, 2006
0.879
+0.161
22.47%
jan 1, 2007
1.372
+0.494
56.2%
jan 1, 2008
3.106
+1.734
126.37%
jan 1, 2009
1.617
-1.49
-47.96%
jan 1, 2010
1.31
-0.307
-18.99%
jan 1, 2011
2.026
+0.716
54.67%
jan 1, 2012
3.022
+0.997
49.2%
jan 1, 2013
1.886
-1.136
-37.58%
jan 1, 2014
1.624
-0.262
-13.91%
jan 1, 2015
1.712
+0.088
5.39%
Ranking of countries by current statistics by years


Comments: