29
/
en
AIzaSyAYiBZKx7MnpbEhh9jyipgxe19OcubqV5w
April 1, 2024
118612
Denmark
DNK
true
2
1
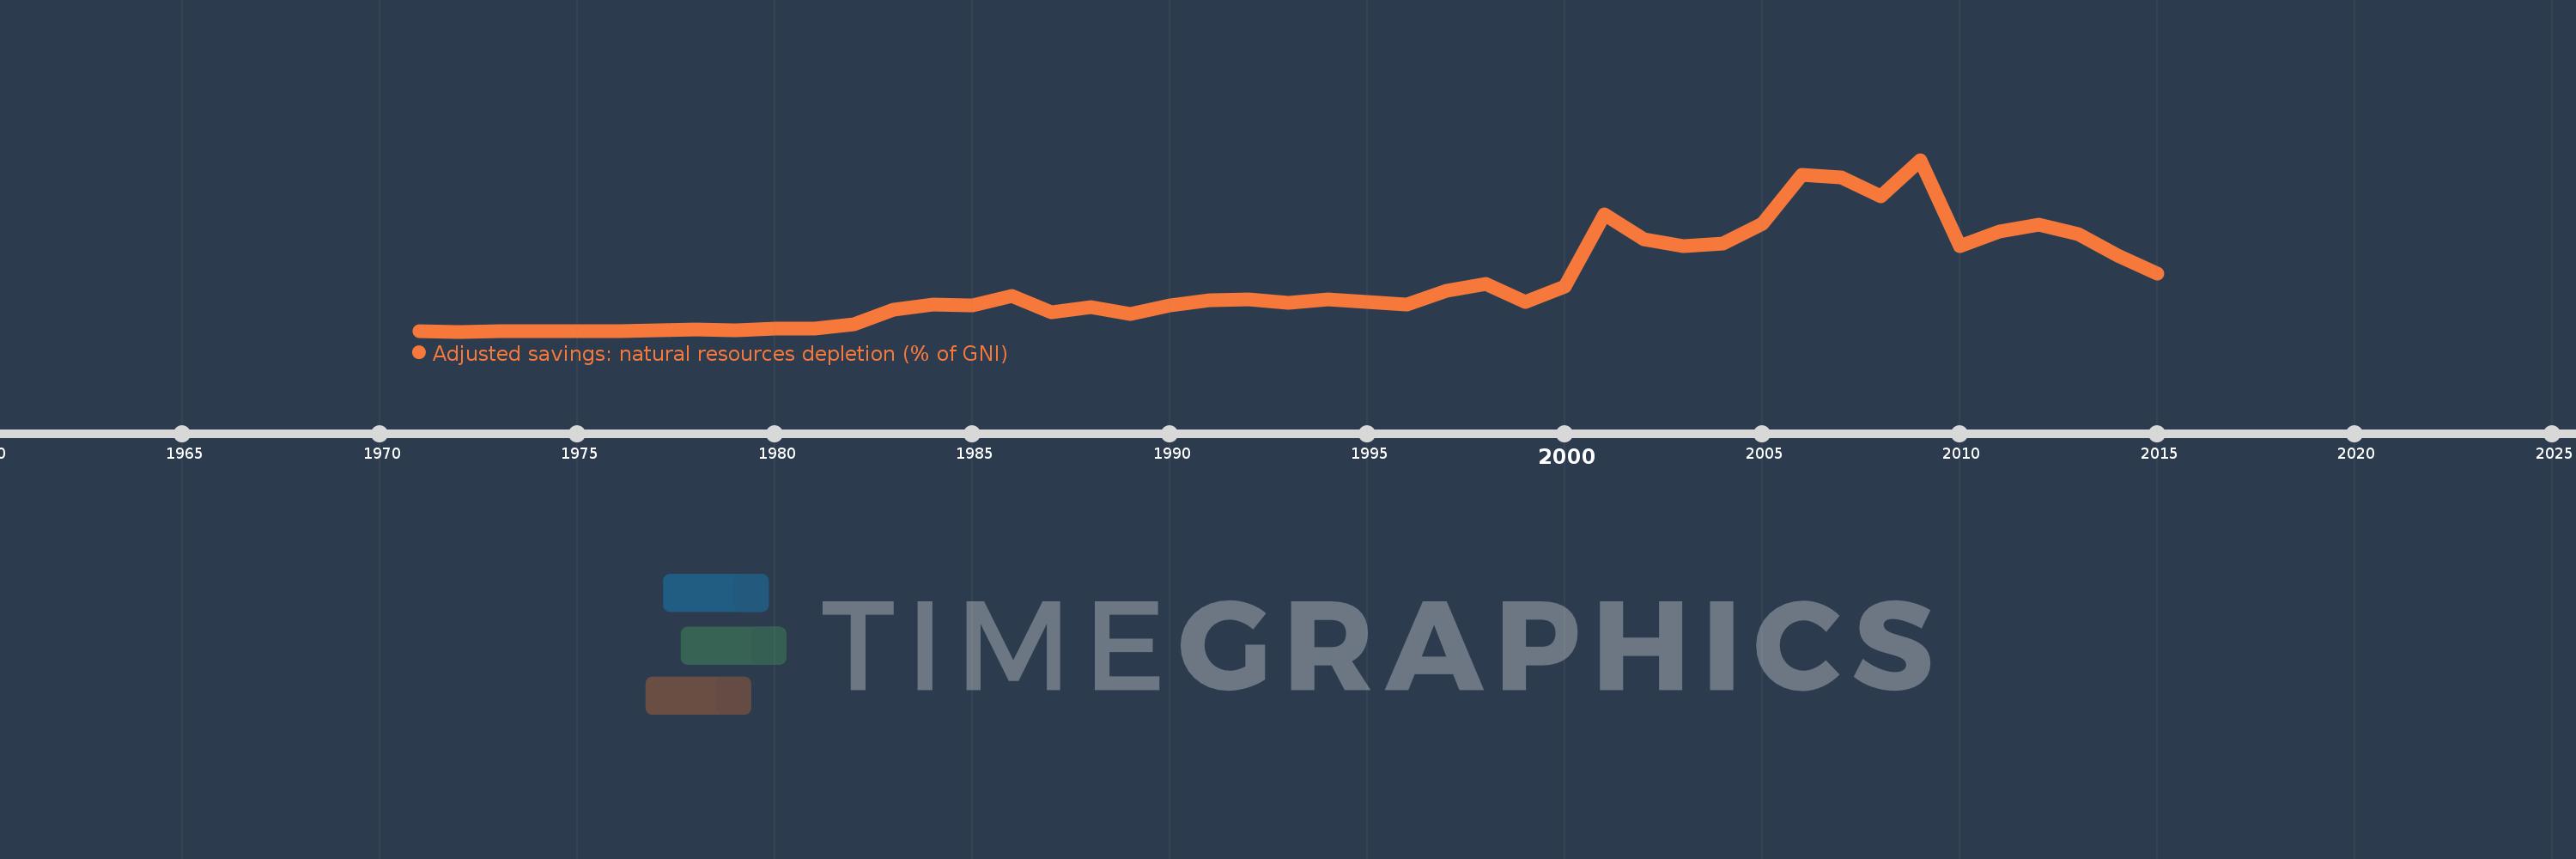
Adjusted savings: natural resources depletion (% of GNI)
2015,2014,2013,2012,2011,2010,2009,2008,2007,2006,2005,2004,2003,2002,2001,2000,1999,1998,1997,1996,1995,1994,1993,1992,1991,1990,1989,1988,1987,1986,1985,1984,1983,1982,1981,1980,1979,1978,1977,1976,1975,1974,1973,1972,1971
This statistics in other country:
AfghanistanAlbaniaAlgeriaAngolaArab WorldArgentinaArmeniaAustraliaAustriaAzerbaijanBahamas, TheBahrainBangladeshBarbadosBelarusBelgiumBelizeBeninBhutanBoliviaBotswanaBrazilBrunei DarussalamBulgariaBurkina FasoBurundiCabo VerdeCambodiaCameroonCanadaCaribbean small statesCentral African RepublicCentral Europe and the BalticsChadChileChinaColombiaComorosCongo, Dem. Rep.Congo, Rep.Costa RicaCote d'IvoireCroatiaCubaCyprusCzech RepublicDenmarkDjiboutiDominicaDominican RepublicEarly-demographic dividendEast Asia & PacificEast Asia & Pacific (excluding high income)East Asia & Pacific (IDA & IBRD countries)EcuadorEgypt, Arab Rep.El SalvadorEquatorial GuineaEritreaEstoniaEthiopiaEuro areaEurope & Central AsiaEurope & Central Asia (excluding high income)Europe & Central Asia (IDA & IBRD countries)European UnionFijiFinlandFragile and conflict affected situationsFranceFrench PolynesiaGabonGambia, TheGeorgiaGermanyGhanaGreeceGuatemalaGuineaGuinea-BissauGuyanaHaitiHeavily indebted poor countries (HIPC)High incomeHondurasHong Kong SAR, ChinaHungaryIBRD onlyIcelandIDA & IBRD totalIDA blendIDA onlyIDA totalIndiaIndonesiaIran, Islamic Rep.IraqIrelandIsraelItalyJamaicaJapanJordanKazakhstanKenyaKiribatiKorea, Rep.KuwaitKyrgyz RepublicLao PDRLate-demographic dividendLatin America & Caribbean Latin America & Caribbean (excluding high income)Latin America & the Caribbean (IDA & IBRD countries)LatviaLeast developed countries: UN classificationLebanonLesothoLiberiaLibyaLithuaniaLow & middle incomeLow incomeLower middle incomeLuxembourgMacedonia, FYRMadagascarMalawiMalaysiaMaldivesMaliMauritaniaMauritiusMexicoMicronesia, Fed. Sts.Middle East & North AfricaMiddle East & North Africa (excluding high income)Middle East & North Africa (IDA & IBRD countries)Middle incomeMoldovaMongoliaMoroccoMozambiqueMyanmarNamibiaNepalNetherlandsNew CaledoniaNew ZealandNicaraguaNigerNigeriaNorth AmericaNorwayOECD membersOmanOther small statesPacific island small statesPakistanPanamaPapua New GuineaParaguayPeruPhilippinesPolandPortugalPost-demographic dividendPre-demographic dividendQatarRomaniaRussian FederationRwandaSamoaSao Tome and PrincipeSaudi ArabiaSenegalSeychellesSierra LeoneSingaporeSlovak RepublicSloveniaSmall statesSolomon IslandsSomaliaSouth AfricaSouth AsiaSouth Asia (IDA & IBRD)SpainSri LankaSt. LuciaSt. Vincent and the GrenadinesSub-Saharan Africa Sub-Saharan Africa (excluding high income)Sub-Saharan Africa (IDA & IBRD countries)SudanSurinameSwazilandSwedenSwitzerlandSyrian Arab RepublicTajikistanTanzaniaThailandTogoTongaTrinidad and TobagoTunisiaTurkeyTurkmenistanUgandaUkraineUnited Arab EmiratesUnited KingdomUnited StatesUpper middle incomeUruguayUzbekistanVanuatuVenezuela, RBVietnamWorldYemen, Rep.ZambiaZimbabwe Timeline:
This timeline shows a graph from 1971 to 2015 of Denmark. No data until 1970. Number of actual observations by date: 45.
Source name:
World Development Indicators
Source organization:
World Bank staff estimates based on sources and methods in World Bank's "The Changing Wealth of Nations: Measuring Sustainable Development in the New Millennium" (2011).
Categories, topics:
Economy & Growth, Energy & Mining
Last updated:
apr 23, 2017
Indicators value changes by year
At the date of observation
Value
Absolute change
Change from previous value
jan 1, 1971
0.001
+0.001
0.0%
jan 1, 1972
0.0
-0.001
-93.99%
jan 1, 1973
0.002
+0.002
6.31K%
jan 1, 1974
0.004
+0.002
70.96%
jan 1, 1975
0.01
+0.006
143.11%
jan 1, 1976
0.012
+0.002
16.02%
jan 1, 1977
0.016
+0.004
36.08%
jan 1, 1978
0.039
+0.023
139.67%
jan 1, 1979
0.026
-0.013
-32.62%
jan 1, 1980
0.056
+0.03
113.29%
jan 1, 1981
0.051
-0.005
-8.77%
jan 1, 1982
0.133
+0.082
160.19%
jan 1, 1983
0.389
+0.256
193.18%
jan 1, 1984
0.48
+0.091
23.52%
jan 1, 1985
0.473
-0.007
-1.5%
jan 1, 1986
0.634
+0.161
34.04%
jan 1, 1987
0.339
-0.295
-46.49%
jan 1, 1988
0.441
+0.101
29.88%
jan 1, 1989
0.312
-0.129
-29.23%
jan 1, 1990
0.463
+0.151
48.37%
jan 1, 1991
0.566
+0.103
22.34%
jan 1, 1992
0.58
+0.014
2.47%
jan 1, 1993
0.521
-0.059
-10.11%
jan 1, 1994
0.572
+0.05
9.69%
jan 1, 1995
0.533
-0.039
-6.81%
jan 1, 1996
0.489
-0.044
-8.27%
jan 1, 1997
0.738
+0.249
50.98%
jan 1, 1998
0.855
+0.117
15.82%
jan 1, 1999
0.531
-0.324
-37.88%
jan 1, 2000
0.807
+0.276
52.01%
jan 1, 2001
2.102
+1.294
160.39%
jan 1, 2002
1.652
-0.45
-21.4%
jan 1, 2003
1.528
-0.123
-7.47%
jan 1, 2004
1.575
+0.046
3.01%
jan 1, 2005
1.937
+0.362
23.0%
jan 1, 2006
2.808
+0.871
44.98%
jan 1, 2007
2.763
-0.045
-1.59%
jan 1, 2008
2.416
-0.347
-12.55%
jan 1, 2009
3.076
+0.659
27.27%
jan 1, 2010
1.538
-1.537
-49.98%
jan 1, 2011
1.785
+0.247
16.04%
jan 1, 2012
1.916
+0.131
7.33%
jan 1, 2013
1.745
-0.171
-8.91%
jan 1, 2014
1.363
-0.382
-21.9%
jan 1, 2015
1.04
-0.322
-23.65%
Ranking of countries by current statistics by years


Comments: