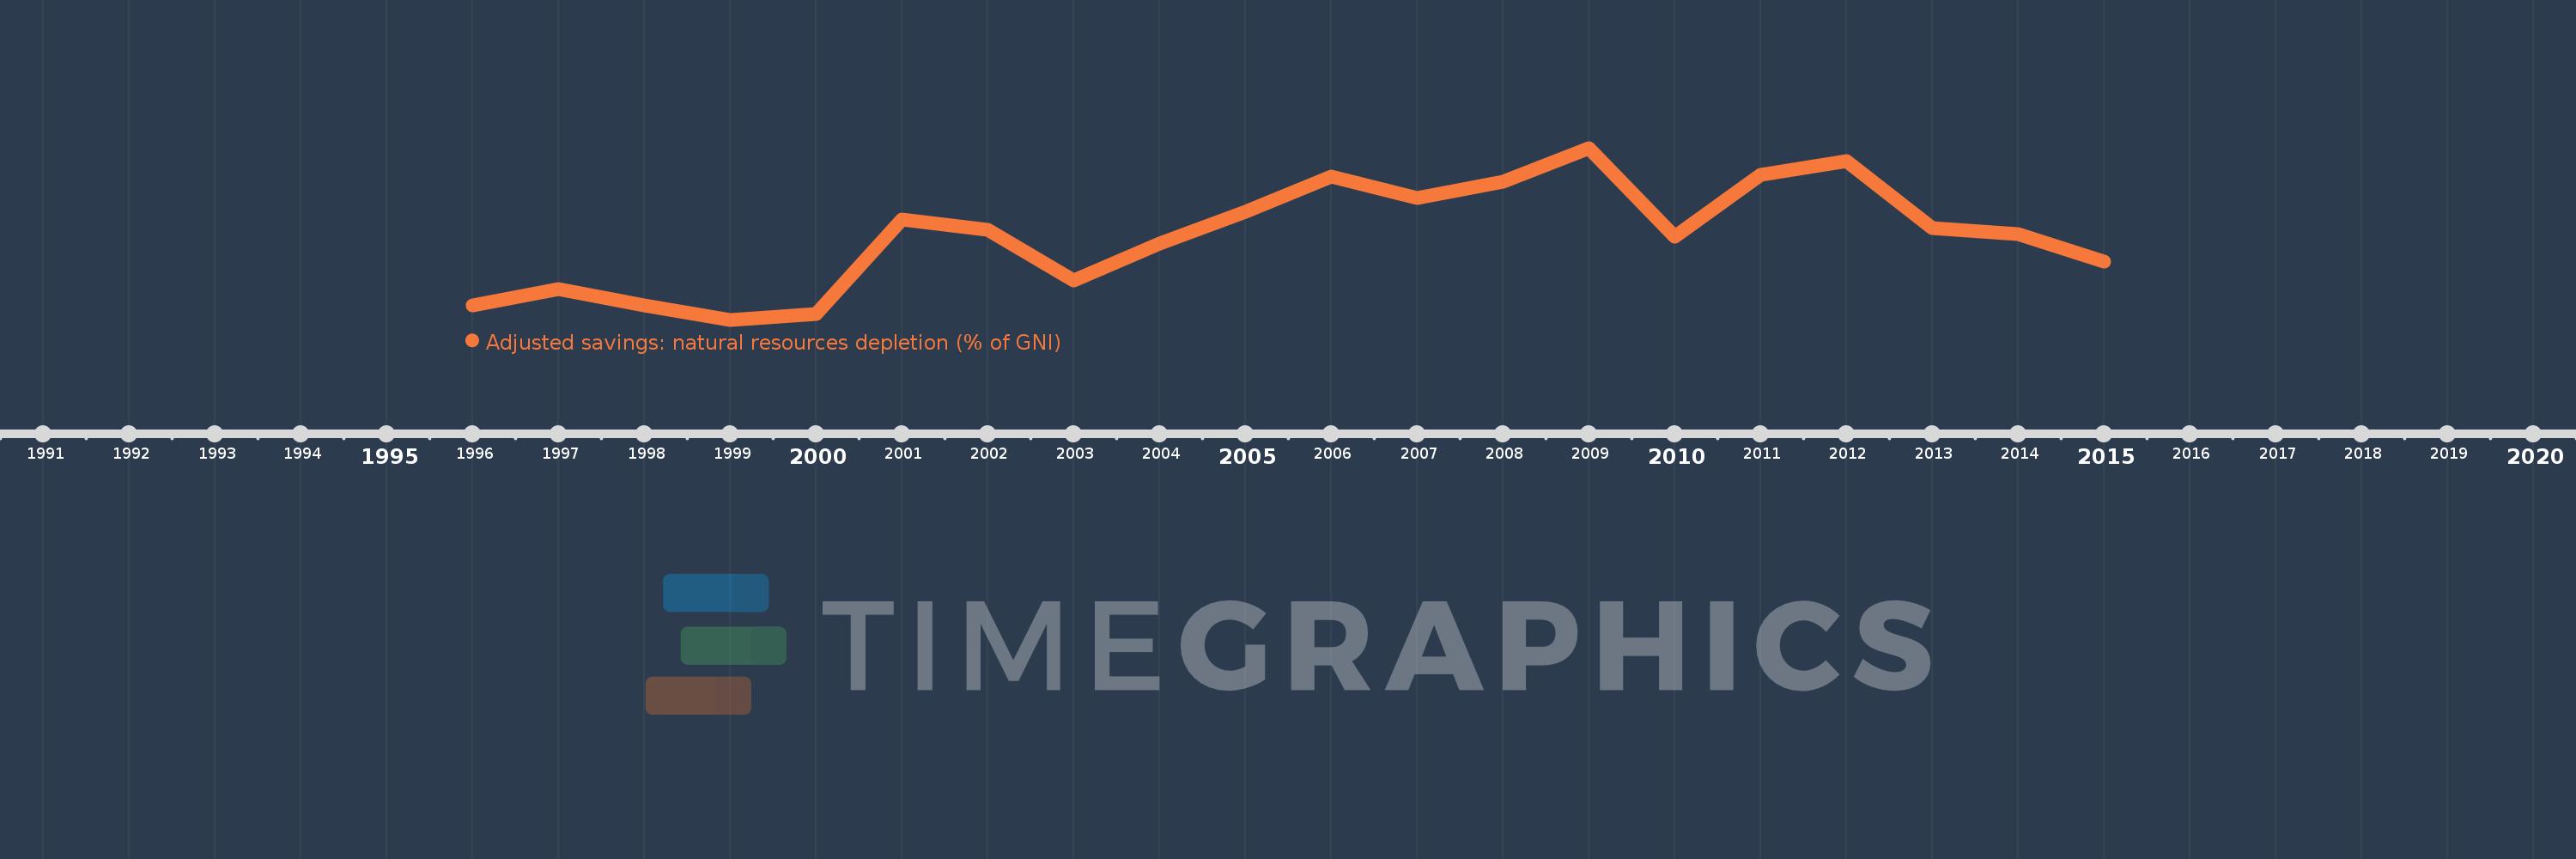
This timeline shows a graph from 1996 to 2015 of Ukraine. No data until 1995. Number of actual observations by date: 20.
Source name:
World Development Indicators
Source organization:
World Bank staff estimates based on sources and methods in World Bank's "The Changing Wealth of Nations: Measuring Sustainable Development in the New Millennium" (2011).
Categories, topics:
Economy & Growth, Energy & Mining
Last updated:
apr 23, 2017
Indicators value changes by year
Meaning:
3.85
Minimum:
1.641
jan 1, 1999
Maximum:
6.173
jan 1, 2009
At the date of observation
Value
Absolute change
Change from the previous value
jan 1, 1996
2.012
+2.012
0.0%
jan 1, 1997
2.454
+0.442
21.97%
jan 1, 1998
2.01
-0.444
-18.08%
jan 1, 1999
1.641
-0.37
-18.38%
jan 1, 2000
1.783
+0.142
8.68%
jan 1, 2001
4.28
+2.497
140.06%
jan 1, 2002
4.008
-0.272
-6.36%
jan 1, 2003
2.67
-1.338
-33.38%
jan 1, 2004
3.659
+0.989
37.04%
jan 1, 2005
4.498
+0.839
22.92%
jan 1, 2006
5.424
+0.926
20.6%
jan 1, 2007
4.841
-0.583
-10.76%
jan 1, 2008
5.284
+0.444
9.17%
jan 1, 2009
6.173
+0.889
16.83%
jan 1, 2010
3.84
-2.333
-37.8%
jan 1, 2011
5.465
+1.625
42.32%
jan 1, 2012
5.821
+0.356
6.51%
jan 1, 2013
4.066
-1.755
-30.15%
jan 1, 2014
3.892
-0.174
-4.28%
jan 1, 2015
3.174
-0.718
-18.45%
Ranking of countries by current statistics by years
