29
/
en
AIzaSyAYiBZKx7MnpbEhh9jyipgxe19OcubqV5w
April 1, 2024
219270
Papua New Guinea
PNG
true
2
1
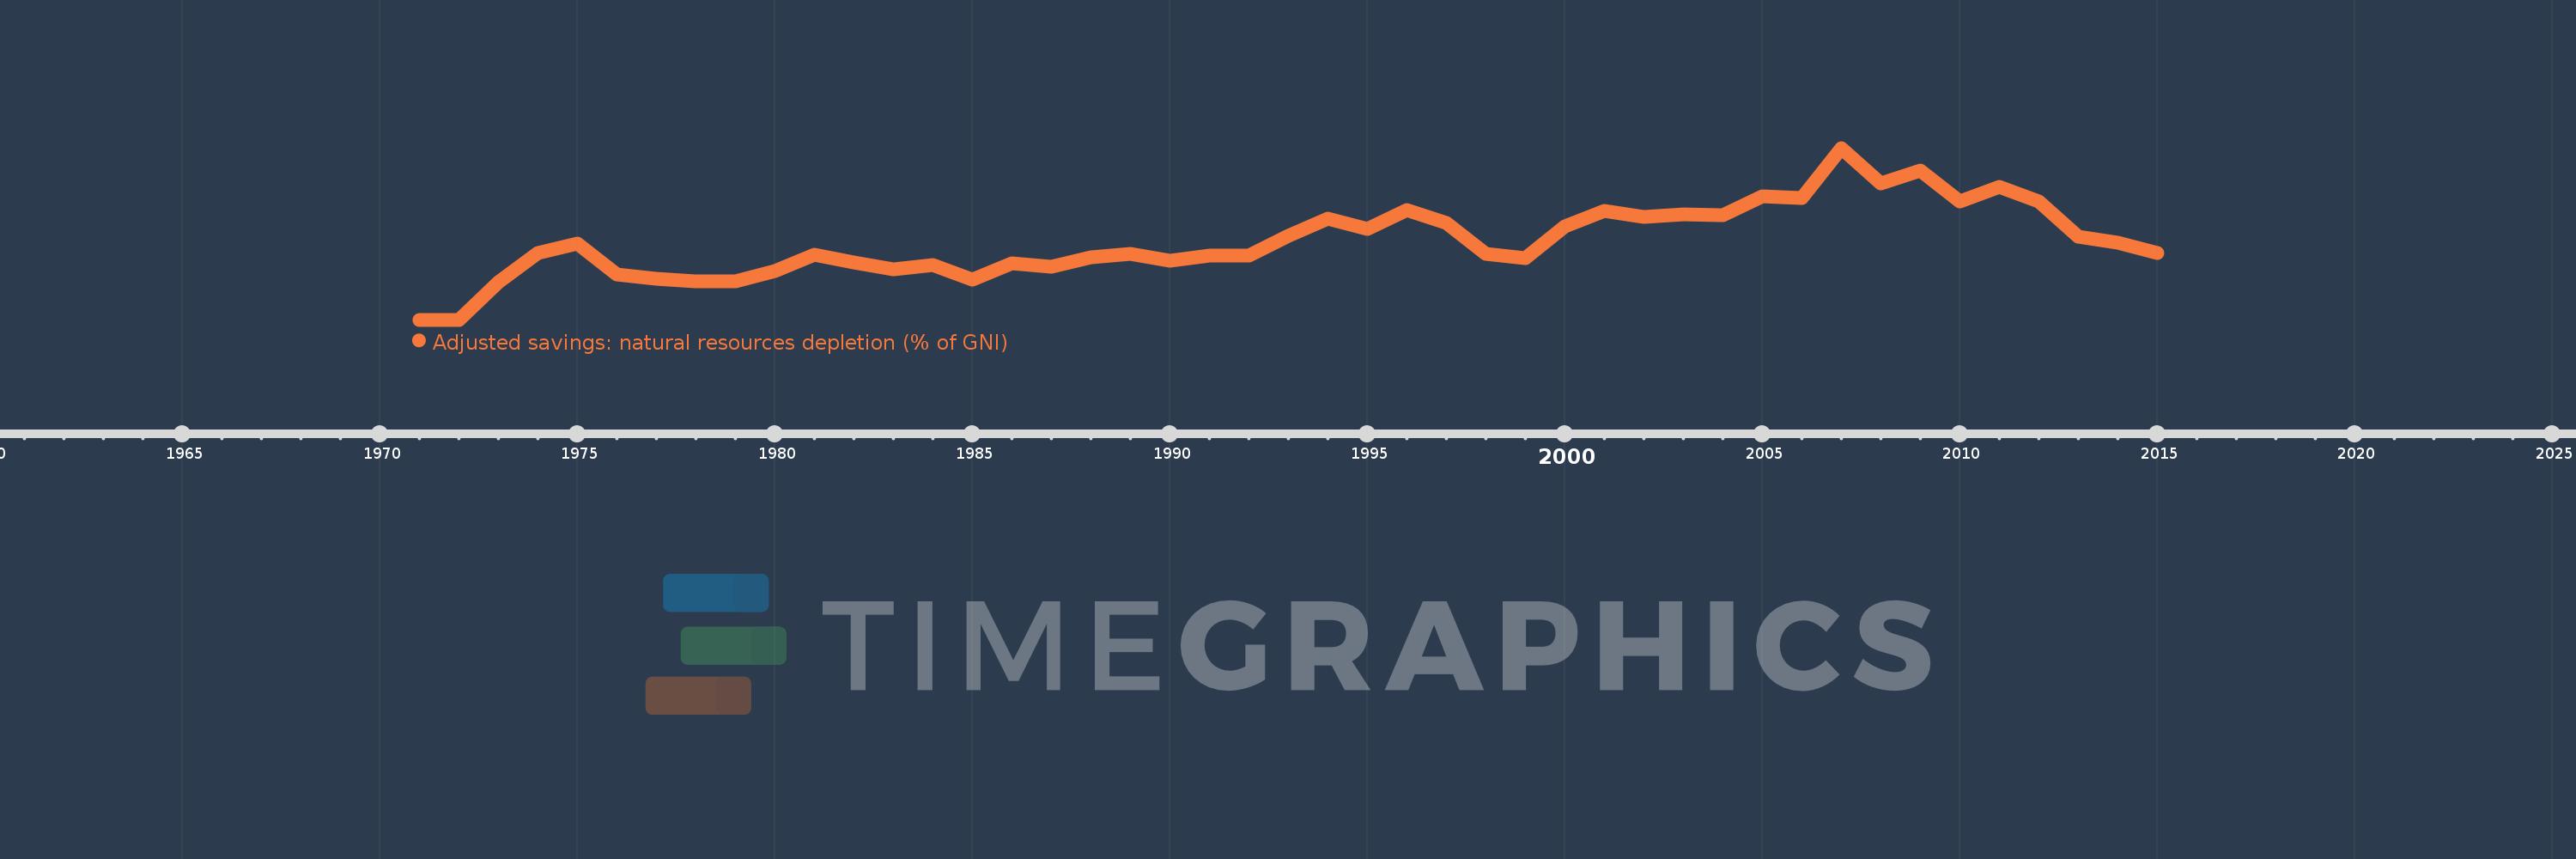
Adjusted savings: natural resources depletion (% of GNI)
2015,2014,2013,2012,2011,2010,2009,2008,2007,2006,2005,2004,2003,2002,2001,2000,1999,1998,1997,1996,1995,1994,1993,1992,1991,1990,1989,1988,1987,1986,1985,1984,1983,1982,1981,1980,1979,1978,1977,1976,1975,1974,1973,1972,1971
This statistics in other country:
AfghanistanAlbaniaAlgeriaAngolaArab WorldArgentinaArmeniaAustraliaAustriaAzerbaijanBahamas, TheBahrainBangladeshBarbadosBelarusBelgiumBelizeBeninBhutanBoliviaBotswanaBrazilBrunei DarussalamBulgariaBurkina FasoBurundiCabo VerdeCambodiaCameroonCanadaCaribbean small statesCentral African RepublicCentral Europe and the BalticsChadChileChinaColombiaComorosCongo, Dem. Rep.Congo, Rep.Costa RicaCote d'IvoireCroatiaCubaCyprusCzech RepublicDenmarkDjiboutiDominicaDominican RepublicEarly-demographic dividendEast Asia & PacificEast Asia & Pacific (excluding high income)East Asia & Pacific (IDA & IBRD countries)EcuadorEgypt, Arab Rep.El SalvadorEquatorial GuineaEritreaEstoniaEthiopiaEuro areaEurope & Central AsiaEurope & Central Asia (excluding high income)Europe & Central Asia (IDA & IBRD countries)European UnionFijiFinlandFragile and conflict affected situationsFranceFrench PolynesiaGabonGambia, TheGeorgiaGermanyGhanaGreeceGuatemalaGuineaGuinea-BissauGuyanaHaitiHeavily indebted poor countries (HIPC)High incomeHondurasHong Kong SAR, ChinaHungaryIBRD onlyIcelandIDA & IBRD totalIDA blendIDA onlyIDA totalIndiaIndonesiaIran, Islamic Rep.IraqIrelandIsraelItalyJamaicaJapanJordanKazakhstanKenyaKiribatiKorea, Rep.KuwaitKyrgyz RepublicLao PDRLate-demographic dividendLatin America & Caribbean Latin America & Caribbean (excluding high income)Latin America & the Caribbean (IDA & IBRD countries)LatviaLeast developed countries: UN classificationLebanonLesothoLiberiaLibyaLithuaniaLow & middle incomeLow incomeLower middle incomeLuxembourgMacedonia, FYRMadagascarMalawiMalaysiaMaldivesMaliMauritaniaMauritiusMexicoMicronesia, Fed. Sts.Middle East & North AfricaMiddle East & North Africa (excluding high income)Middle East & North Africa (IDA & IBRD countries)Middle incomeMoldovaMongoliaMoroccoMozambiqueMyanmarNamibiaNepalNetherlandsNew CaledoniaNew ZealandNicaraguaNigerNigeriaNorth AmericaNorwayOECD membersOmanOther small statesPacific island small statesPakistanPanamaPapua New GuineaParaguayPeruPhilippinesPolandPortugalPost-demographic dividendPre-demographic dividendQatarRomaniaRussian FederationRwandaSamoaSao Tome and PrincipeSaudi ArabiaSenegalSeychellesSierra LeoneSingaporeSlovak RepublicSloveniaSmall statesSolomon IslandsSomaliaSouth AfricaSouth AsiaSouth Asia (IDA & IBRD)SpainSri LankaSt. LuciaSt. Vincent and the GrenadinesSub-Saharan Africa Sub-Saharan Africa (excluding high income)Sub-Saharan Africa (IDA & IBRD countries)SudanSurinameSwazilandSwedenSwitzerlandSyrian Arab RepublicTajikistanTanzaniaThailandTogoTongaTrinidad and TobagoTunisiaTurkeyTurkmenistanUgandaUkraineUnited Arab EmiratesUnited KingdomUnited StatesUpper middle incomeUruguayUzbekistanVanuatuVenezuela, RBVietnamWorldYemen, Rep.ZambiaZimbabwe Timeline:
This timeline shows a graph from 1971 to 2015 of Papua New Guinea. No data until 1970. Number of actual observations by date: 45.
Source name:
World Development Indicators
Source organization:
World Bank staff estimates based on sources and methods in World Bank's "The Changing Wealth of Nations: Measuring Sustainable Development in the New Millennium" (2011).
Categories, topics:
Economy & Growth, Energy & Mining
Last updated:
apr 23, 2017
Indicators value changes by year
Maximum:
38.739
jan 1, 2007
At the date of observation
Value
Absolute change
Change from previous value
jan 1, 1973
8.495
+8.495
%
jan 1, 1974
15.077
+6.582
77.49%
jan 1, 1975
17.205
+2.129
14.12%
jan 1, 1976
10.259
-6.947
-40.38%
jan 1, 1977
9.322
-0.937
-9.13%
jan 1, 1978
8.582
-0.739
-7.93%
jan 1, 1979
8.728
+0.146
1.7%
jan 1, 1980
10.917
+2.188
25.07%
jan 1, 1981
14.731
+3.814
34.94%
jan 1, 1982
12.939
-1.792
-12.16%
jan 1, 1983
11.344
-1.595
-12.33%
jan 1, 1984
12.269
+0.925
8.15%
jan 1, 1985
8.983
-3.285
-26.78%
jan 1, 1986
12.71
+3.726
41.48%
jan 1, 1987
11.949
-0.76
-5.98%
jan 1, 1988
14.071
+2.121
17.75%
jan 1, 1989
14.765
+0.695
4.94%
jan 1, 1990
13.317
-1.448
-9.81%
jan 1, 1991
14.404
+1.087
8.16%
jan 1, 1992
14.502
+0.099
0.68%
jan 1, 1993
19.009
+4.506
31.07%
jan 1, 1994
22.816
+3.807
20.03%
jan 1, 1995
20.531
-2.285
-10.01%
jan 1, 1996
24.819
+4.288
20.89%
jan 1, 1997
21.871
-2.948
-11.88%
jan 1, 1998
14.818
-7.053
-32.25%
jan 1, 1999
13.894
-0.924
-6.24%
jan 1, 2000
20.967
+7.073
50.91%
jan 1, 2001
24.535
+3.568
17.02%
jan 1, 2002
23.094
-1.441
-5.87%
jan 1, 2003
23.7
+0.606
2.62%
jan 1, 2004
23.517
-0.183
-0.77%
jan 1, 2005
27.82
+4.303
18.3%
jan 1, 2006
27.373
-0.446
-1.6%
jan 1, 2007
38.739
+11.365
41.52%
jan 1, 2008
30.645
-8.093
-20.89%
jan 1, 2009
33.581
+2.936
9.58%
jan 1, 2010
26.608
-6.973
-20.77%
jan 1, 2011
29.963
+3.355
12.61%
jan 1, 2012
26.723
-3.24
-10.81%
jan 1, 2013
18.688
-8.035
-30.07%
jan 1, 2014
17.407
-1.282
-6.86%
jan 1, 2015
15.031
-2.376
-13.65%
Ranking of countries by current statistics by years


Comments: