29
/
en
AIzaSyAYiBZKx7MnpbEhh9jyipgxe19OcubqV5w
April 1, 2024
67390
Angola
AGO
true
2
1
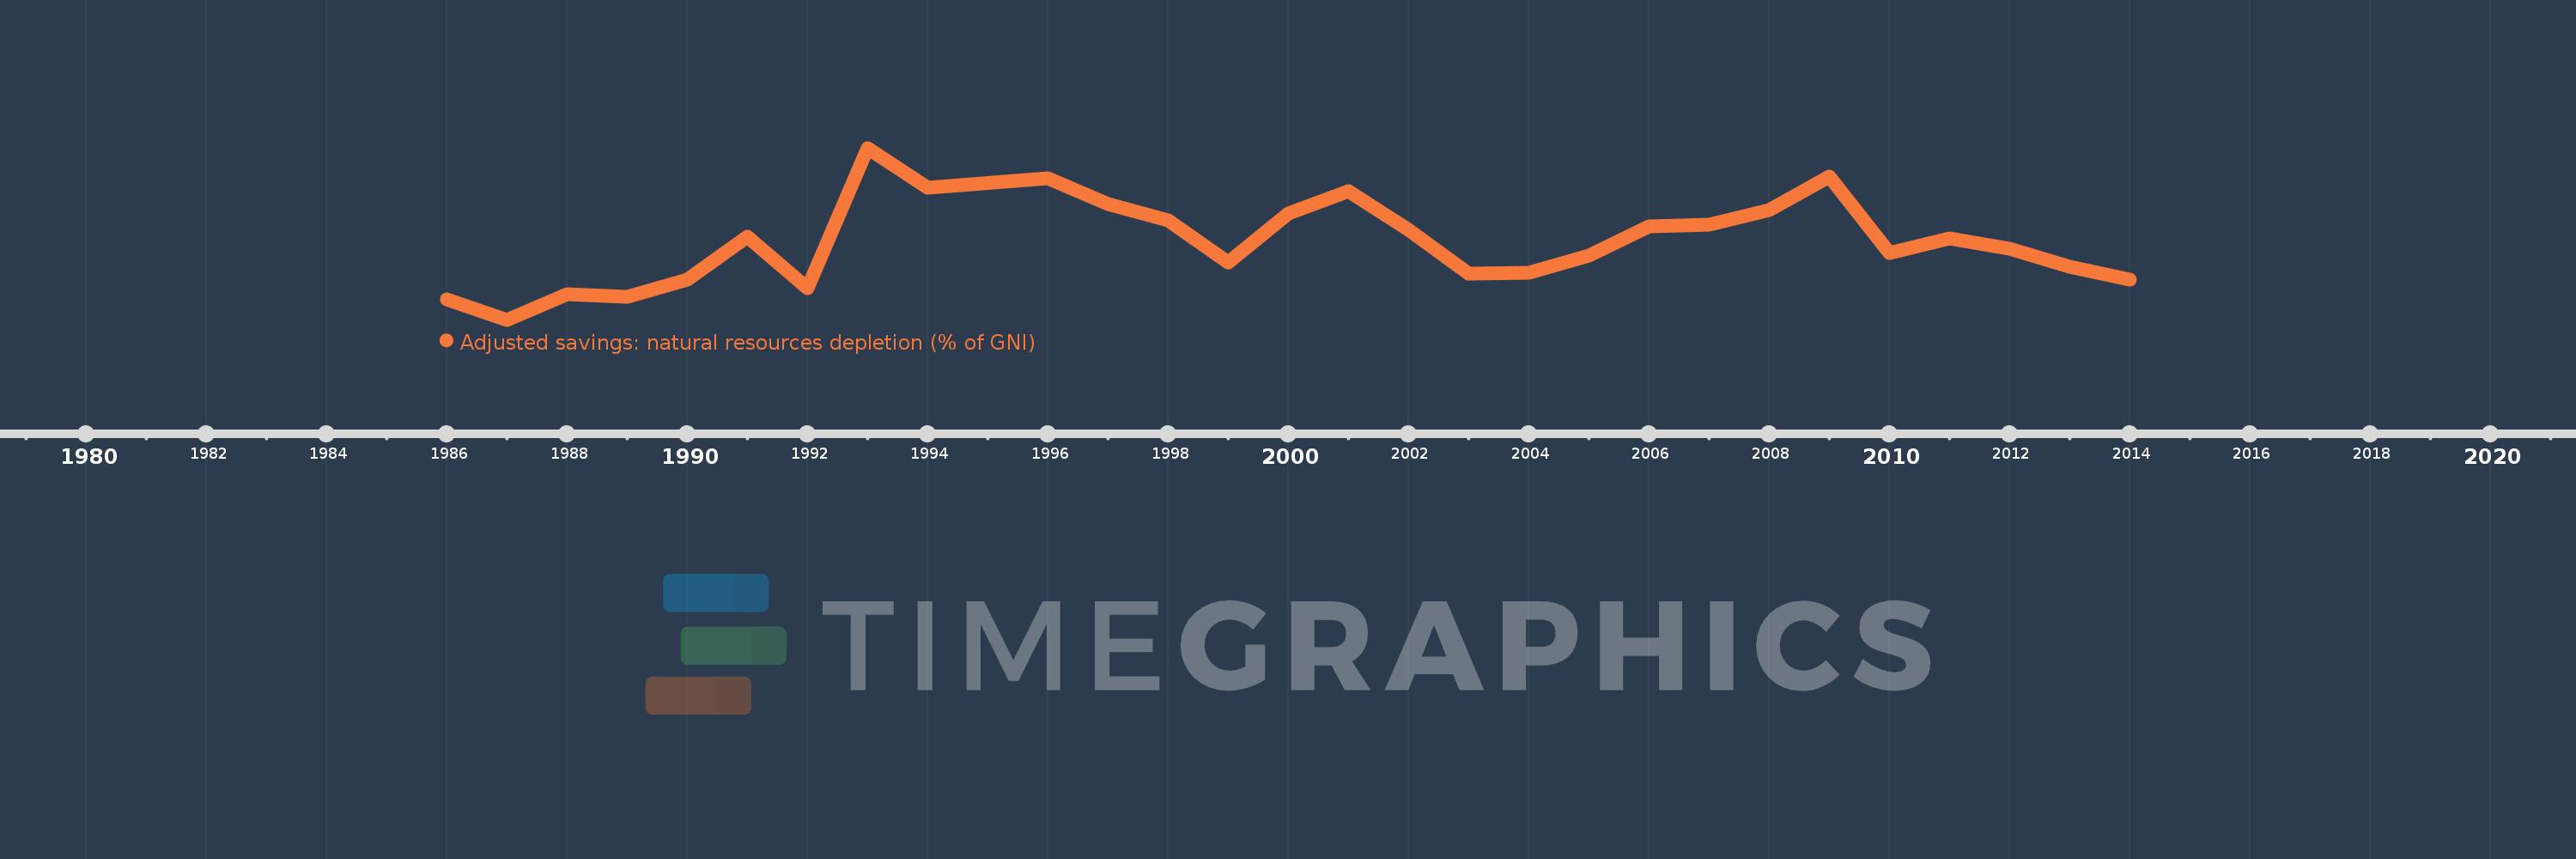
Adjusted savings: natural resources depletion (% of GNI)
2014,2013,2012,2011,2010,2009,2008,2007,2006,2005,2004,2003,2002,2001,2000,1999,1998,1997,1996,1994,1993,1992,1991,1990,1989,1988,1987,1986
This statistics in other country:
AfghanistanAlbaniaAlgeriaAngolaArab WorldArgentinaArmeniaAustraliaAustriaAzerbaijanBahamas, TheBahrainBangladeshBarbadosBelarusBelgiumBelizeBeninBhutanBoliviaBotswanaBrazilBrunei DarussalamBulgariaBurkina FasoBurundiCabo VerdeCambodiaCameroonCanadaCaribbean small statesCentral African RepublicCentral Europe and the BalticsChadChileChinaColombiaComorosCongo, Dem. Rep.Congo, Rep.Costa RicaCote d'IvoireCroatiaCubaCyprusCzech RepublicDenmarkDjiboutiDominicaDominican RepublicEarly-demographic dividendEast Asia & PacificEast Asia & Pacific (excluding high income)East Asia & Pacific (IDA & IBRD countries)EcuadorEgypt, Arab Rep.El SalvadorEquatorial GuineaEritreaEstoniaEthiopiaEuro areaEurope & Central AsiaEurope & Central Asia (excluding high income)Europe & Central Asia (IDA & IBRD countries)European UnionFijiFinlandFragile and conflict affected situationsFranceFrench PolynesiaGabonGambia, TheGeorgiaGermanyGhanaGreeceGuatemalaGuineaGuinea-BissauGuyanaHaitiHeavily indebted poor countries (HIPC)High incomeHondurasHong Kong SAR, ChinaHungaryIBRD onlyIcelandIDA & IBRD totalIDA blendIDA onlyIDA totalIndiaIndonesiaIran, Islamic Rep.IraqIrelandIsraelItalyJamaicaJapanJordanKazakhstanKenyaKiribatiKorea, Rep.KuwaitKyrgyz RepublicLao PDRLate-demographic dividendLatin America & Caribbean Latin America & Caribbean (excluding high income)Latin America & the Caribbean (IDA & IBRD countries)LatviaLeast developed countries: UN classificationLebanonLesothoLiberiaLibyaLithuaniaLow & middle incomeLow incomeLower middle incomeLuxembourgMacedonia, FYRMadagascarMalawiMalaysiaMaldivesMaliMauritaniaMauritiusMexicoMicronesia, Fed. Sts.Middle East & North AfricaMiddle East & North Africa (excluding high income)Middle East & North Africa (IDA & IBRD countries)Middle incomeMoldovaMongoliaMoroccoMozambiqueMyanmarNamibiaNepalNetherlandsNew CaledoniaNew ZealandNicaraguaNigerNigeriaNorth AmericaNorwayOECD membersOmanOther small statesPacific island small statesPakistanPanamaPapua New GuineaParaguayPeruPhilippinesPolandPortugalPost-demographic dividendPre-demographic dividendQatarRomaniaRussian FederationRwandaSamoaSao Tome and PrincipeSaudi ArabiaSenegalSeychellesSierra LeoneSingaporeSlovak RepublicSloveniaSmall statesSolomon IslandsSomaliaSouth AfricaSouth AsiaSouth Asia (IDA & IBRD)SpainSri LankaSt. LuciaSt. Vincent and the GrenadinesSub-Saharan Africa Sub-Saharan Africa (excluding high income)Sub-Saharan Africa (IDA & IBRD countries)SudanSurinameSwazilandSwedenSwitzerlandSyrian Arab RepublicTajikistanTanzaniaThailandTogoTongaTrinidad and TobagoTunisiaTurkeyTurkmenistanUgandaUkraineUnited Arab EmiratesUnited KingdomUnited StatesUpper middle incomeUruguayUzbekistanVanuatuVenezuela, RBVietnamWorldYemen, Rep.ZambiaZimbabwe Timeline:
This timeline shows a graph from 1986 to 2014 of Angola. No data until 1985. Number of actual observations by date: 28.
Source name:
World Development Indicators
Source organization:
World Bank staff estimates based on sources and methods in World Bank's "The Changing Wealth of Nations: Measuring Sustainable Development in the New Millennium" (2011).
Categories, topics:
Economy & Growth, Energy & Mining
Last updated:
apr 23, 2017
Indicators value changes by year
Minimum:
10.651
jan 1, 1987
Maximum:
70.364
jan 1, 1993
At the date of observation
Value
Absolute change
Change from previous value
jan 1, 1986
17.791
+17.791
0.0%
jan 1, 1987
10.651
-7.14
-40.13%
jan 1, 1988
19.376
+8.725
81.92%
jan 1, 1989
18.571
-0.805
-4.15%
jan 1, 1990
24.63
+6.059
32.62%
jan 1, 1991
39.523
+14.893
60.47%
jan 1, 1992
21.609
-17.914
-45.33%
jan 1, 1993
70.364
+48.755
225.62%
jan 1, 1994
56.643
-13.721
-19.5%
jan 1, 1996
59.889
+3.246
5.73%
jan 1, 1997
51.007
-8.882
-14.83%
jan 1, 1998
45.077
-5.93
-11.63%
jan 1, 1999
30.596
-14.481
-32.13%
jan 1, 2000
47.697
+17.101
55.89%
jan 1, 2001
55.229
+7.532
15.79%
jan 1, 2002
42.023
-13.206
-23.91%
jan 1, 2003
26.548
-15.474
-36.82%
jan 1, 2004
26.998
+0.449
1.69%
jan 1, 2005
32.925
+5.927
21.96%
jan 1, 2006
43.211
+10.286
31.24%
jan 1, 2007
43.694
+0.483
1.12%
jan 1, 2008
48.733
+5.039
11.53%
jan 1, 2009
60.312
+11.579
23.76%
jan 1, 2010
33.869
-26.443
-43.84%
jan 1, 2011
38.816
+4.947
14.61%
jan 1, 2012
35.302
-3.514
-9.05%
jan 1, 2013
28.929
-6.373
-18.05%
jan 1, 2014
24.503
-4.426
-15.3%
Ranking of countries by current statistics by years


Comments: