29
/
en
AIzaSyAYiBZKx7MnpbEhh9jyipgxe19OcubqV5w
April 1, 2024
164434
Jordan
JOR
true
2
1
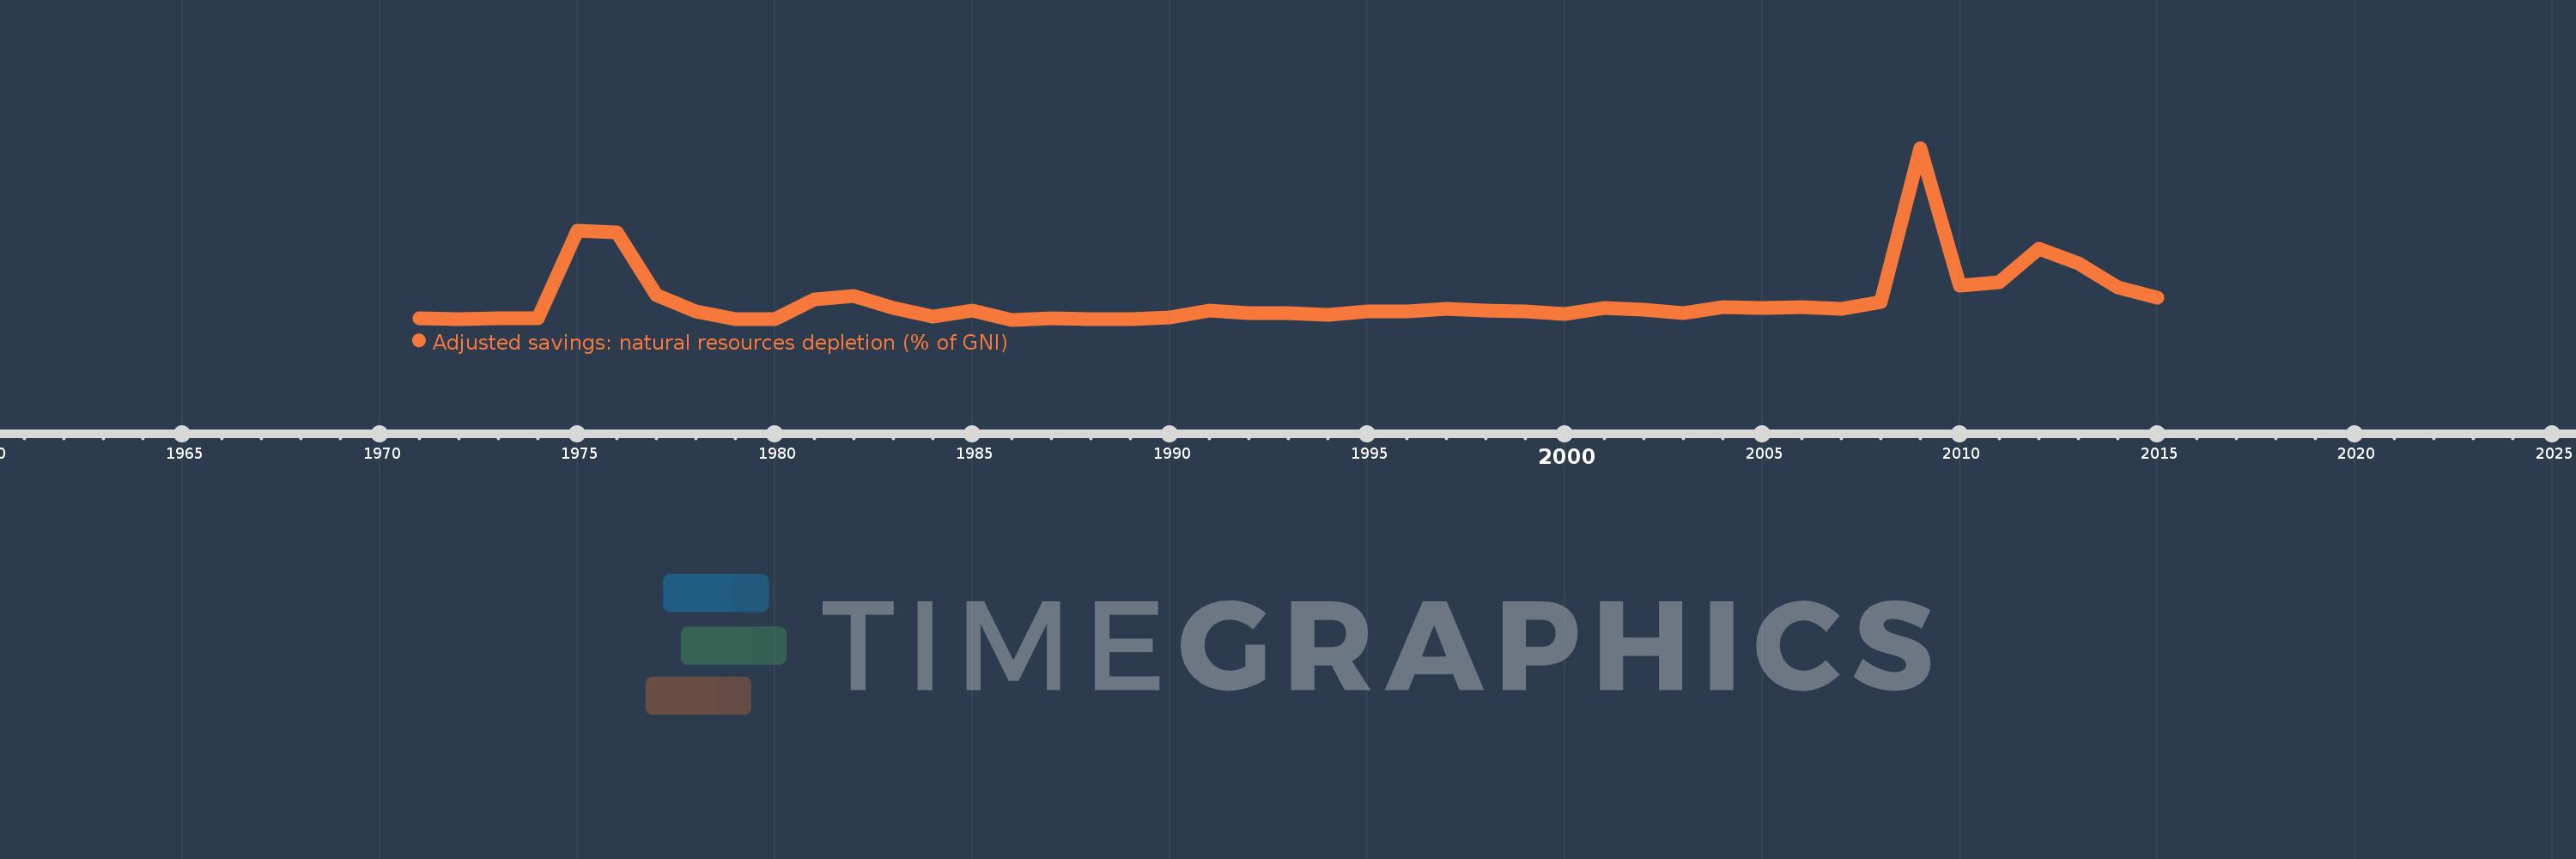
Adjusted savings: natural resources depletion (% of GNI)
2015,2014,2013,2012,2011,2010,2009,2008,2007,2006,2005,2004,2003,2002,2001,2000,1999,1998,1997,1996,1995,1994,1993,1992,1991,1990,1989,1988,1987,1986,1985,1984,1983,1982,1981,1980,1979,1978,1977,1976,1975,1974,1973,1972,1971
This statistics in other country:
AfghanistanAlbaniaAlgeriaAngolaArab WorldArgentinaArmeniaAustraliaAustriaAzerbaijanBahamas, TheBahrainBangladeshBarbadosBelarusBelgiumBelizeBeninBhutanBoliviaBotswanaBrazilBrunei DarussalamBulgariaBurkina FasoBurundiCabo VerdeCambodiaCameroonCanadaCaribbean small statesCentral African RepublicCentral Europe and the BalticsChadChileChinaColombiaComorosCongo, Dem. Rep.Congo, Rep.Costa RicaCote d'IvoireCroatiaCubaCyprusCzech RepublicDenmarkDjiboutiDominicaDominican RepublicEarly-demographic dividendEast Asia & PacificEast Asia & Pacific (excluding high income)East Asia & Pacific (IDA & IBRD countries)EcuadorEgypt, Arab Rep.El SalvadorEquatorial GuineaEritreaEstoniaEthiopiaEuro areaEurope & Central AsiaEurope & Central Asia (excluding high income)Europe & Central Asia (IDA & IBRD countries)European UnionFijiFinlandFragile and conflict affected situationsFranceFrench PolynesiaGabonGambia, TheGeorgiaGermanyGhanaGreeceGuatemalaGuineaGuinea-BissauGuyanaHaitiHeavily indebted poor countries (HIPC)High incomeHondurasHong Kong SAR, ChinaHungaryIBRD onlyIcelandIDA & IBRD totalIDA blendIDA onlyIDA totalIndiaIndonesiaIran, Islamic Rep.IraqIrelandIsraelItalyJamaicaJapanJordanKazakhstanKenyaKiribatiKorea, Rep.KuwaitKyrgyz RepublicLao PDRLate-demographic dividendLatin America & Caribbean Latin America & Caribbean (excluding high income)Latin America & the Caribbean (IDA & IBRD countries)LatviaLeast developed countries: UN classificationLebanonLesothoLiberiaLibyaLithuaniaLow & middle incomeLow incomeLower middle incomeLuxembourgMacedonia, FYRMadagascarMalawiMalaysiaMaldivesMaliMauritaniaMauritiusMexicoMicronesia, Fed. Sts.Middle East & North AfricaMiddle East & North Africa (excluding high income)Middle East & North Africa (IDA & IBRD countries)Middle incomeMoldovaMongoliaMoroccoMozambiqueMyanmarNamibiaNepalNetherlandsNew CaledoniaNew ZealandNicaraguaNigerNigeriaNorth AmericaNorwayOECD membersOmanOther small statesPacific island small statesPakistanPanamaPapua New GuineaParaguayPeruPhilippinesPolandPortugalPost-demographic dividendPre-demographic dividendQatarRomaniaRussian FederationRwandaSamoaSao Tome and PrincipeSaudi ArabiaSenegalSeychellesSierra LeoneSingaporeSlovak RepublicSloveniaSmall statesSolomon IslandsSomaliaSouth AfricaSouth AsiaSouth Asia (IDA & IBRD)SpainSri LankaSt. LuciaSt. Vincent and the GrenadinesSub-Saharan Africa Sub-Saharan Africa (excluding high income)Sub-Saharan Africa (IDA & IBRD countries)SudanSurinameSwazilandSwedenSwitzerlandSyrian Arab RepublicTajikistanTanzaniaThailandTogoTongaTrinidad and TobagoTunisiaTurkeyTurkmenistanUgandaUkraineUnited Arab EmiratesUnited KingdomUnited StatesUpper middle incomeUruguayUzbekistanVanuatuVenezuela, RBVietnamWorldYemen, Rep.ZambiaZimbabwe Timeline:
This timeline shows a graph from 1971 to 2015 of Jordan. No data until 1970. Number of actual observations by date: 45.
Source name:
World Development Indicators
Source organization:
World Bank staff estimates based on sources and methods in World Bank's "The Changing Wealth of Nations: Measuring Sustainable Development in the New Millennium" (2011).
Categories, topics:
Economy & Growth, Energy & Mining
Last updated:
apr 23, 2017
Indicators value changes by year
At the date of observation
Value
Absolute change
Change from previous value
jan 1, 1971
0.037
+0.037
0.0%
jan 1, 1972
0.032
-0.004
-12.19%
jan 1, 1973
0.039
+0.007
21.58%
jan 1, 1974
0.049
+0.01
25.6%
jan 1, 1975
1.95
+1.901
3.85K%
jan 1, 1976
1.898
-0.052
-2.66%
jan 1, 1977
0.544
-1.355
-71.36%
jan 1, 1978
0.196
-0.347
-63.9%
jan 1, 1979
0.024
-0.172
-87.79%
jan 1, 1980
0.023
-0.001
-3.51%
jan 1, 1981
0.462
+0.439
1.9K%
jan 1, 1982
0.52
+0.059
12.67%
jan 1, 1983
0.268
-0.252
-48.5%
jan 1, 1984
0.075
-0.193
-71.95%
jan 1, 1985
0.215
+0.14
185.96%
jan 1, 1986
0.012
-0.203
-94.57%
jan 1, 1987
0.048
+0.037
313.86%
jan 1, 1988
0.032
-0.017
-34.66%
jan 1, 1989
0.032
+0.0
0.49%
jan 1, 1990
0.071
+0.039
123.99%
jan 1, 1991
0.215
+0.144
203.16%
jan 1, 1992
0.147
-0.068
-31.73%
jan 1, 1993
0.148
+0.001
0.57%
jan 1, 1994
0.127
-0.021
-13.91%
jan 1, 1995
0.198
+0.07
55.14%
jan 1, 1996
0.194
-0.004
-1.95%
jan 1, 1997
0.24
+0.046
23.89%
jan 1, 1998
0.216
-0.024
-9.9%
jan 1, 1999
0.186
-0.03
-14.05%
jan 1, 2000
0.145
-0.041
-22.24%
jan 1, 2001
0.267
+0.122
84.72%
jan 1, 2002
0.236
-0.031
-11.48%
jan 1, 2003
0.158
-0.078
-33.0%
jan 1, 2004
0.283
+0.125
79.07%
jan 1, 2005
0.276
-0.007
-2.53%
jan 1, 2006
0.291
+0.015
5.3%
jan 1, 2007
0.249
-0.042
-14.32%
jan 1, 2008
0.403
+0.154
61.7%
jan 1, 2009
3.739
+3.335
827.38%
jan 1, 2010
0.757
-2.981
-79.74%
jan 1, 2011
0.823
+0.066
8.67%
jan 1, 2012
1.559
+0.736
89.47%
jan 1, 2013
1.245
-0.315
-20.17%
jan 1, 2014
0.722
-0.523
-42.03%
jan 1, 2015
0.492
-0.23
-31.89%
Ranking of countries by current statistics by years


Comments: