29
/
en
AIzaSyAYiBZKx7MnpbEhh9jyipgxe19OcubqV5w
April 1, 2024
261831
Thailand
THA
true
2
1
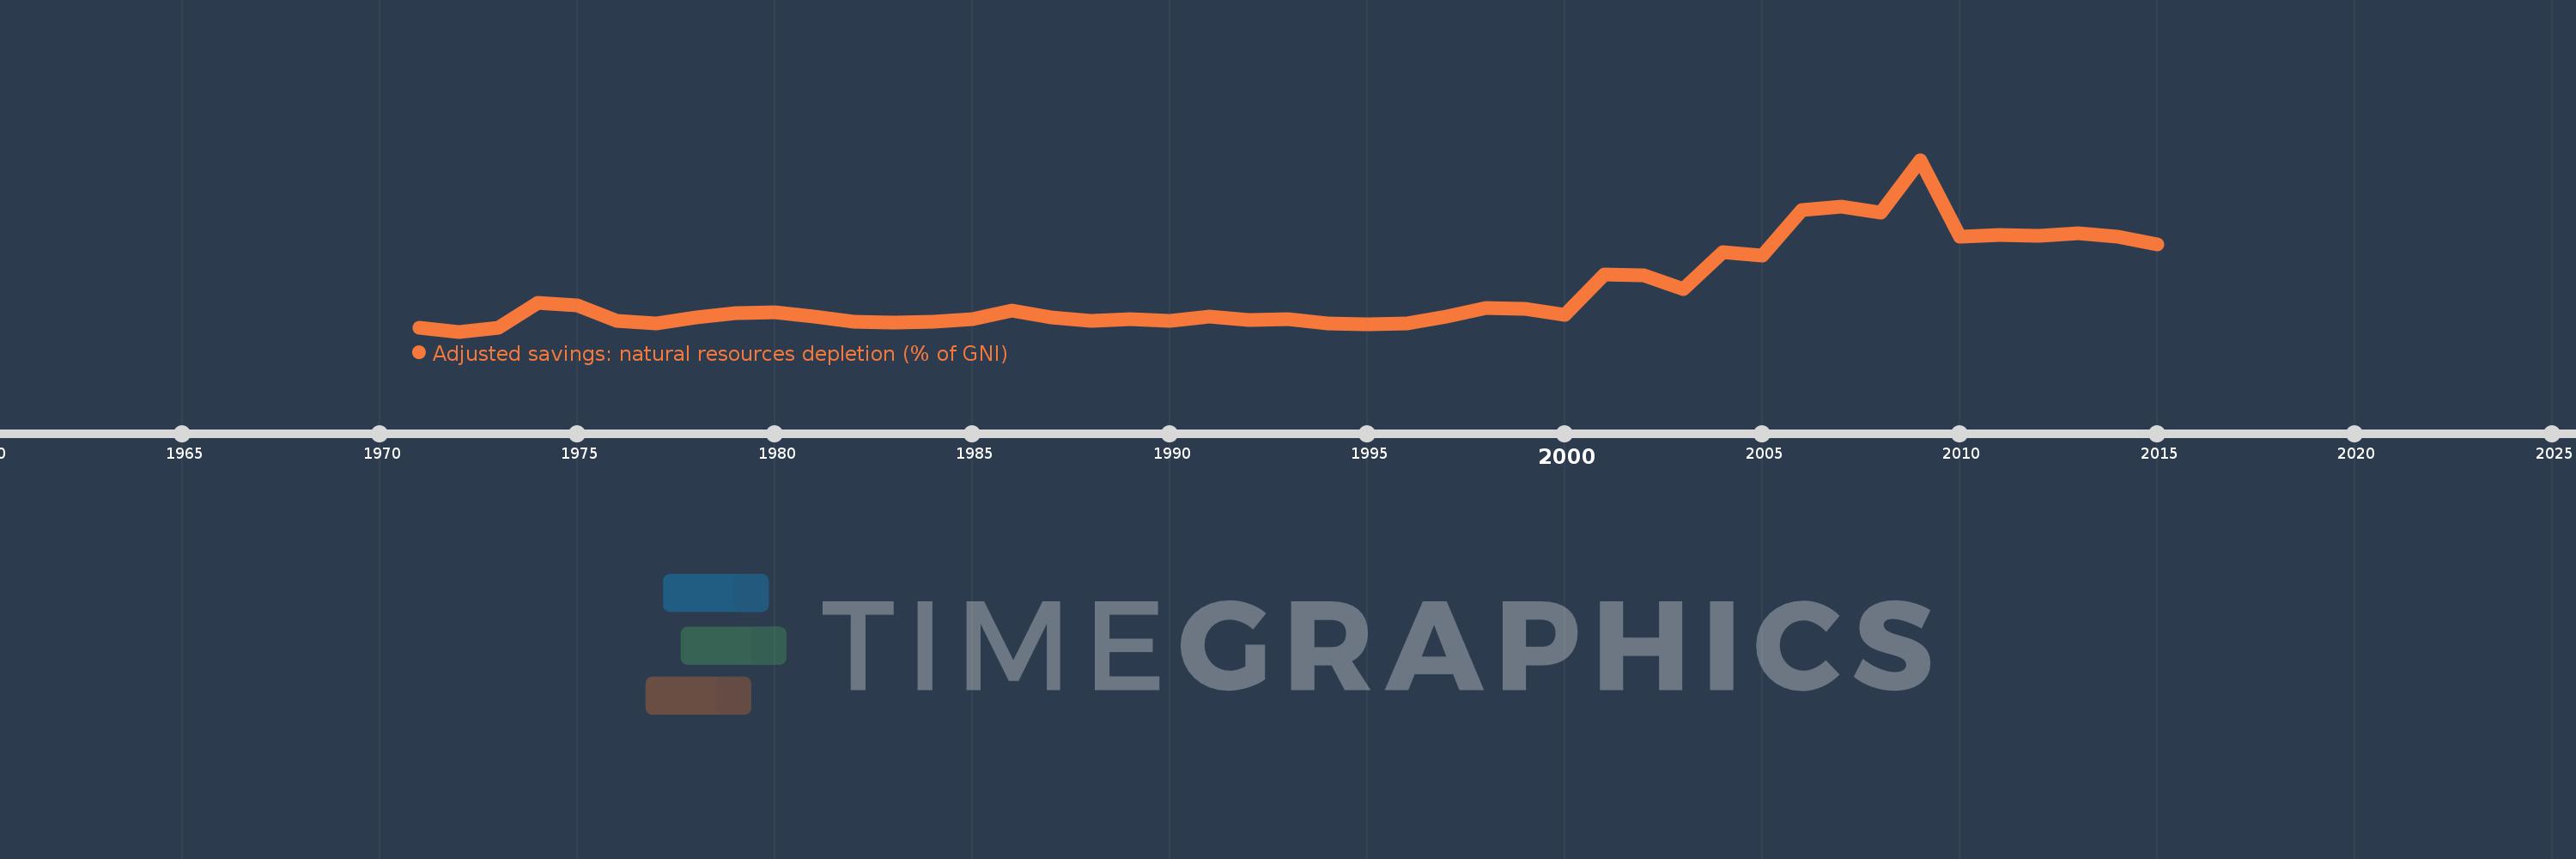
Adjusted savings: natural resources depletion (% of GNI)
2015,2014,2013,2012,2011,2010,2009,2008,2007,2006,2005,2004,2003,2002,2001,2000,1999,1998,1997,1996,1995,1994,1993,1992,1991,1990,1989,1988,1987,1986,1985,1984,1983,1982,1981,1980,1979,1978,1977,1976,1975,1974,1973,1972,1971
This statistics in other country:
AfghanistanAlbaniaAlgeriaAngolaArab WorldArgentinaArmeniaAustraliaAustriaAzerbaijanBahamas, TheBahrainBangladeshBarbadosBelarusBelgiumBelizeBeninBhutanBoliviaBotswanaBrazilBrunei DarussalamBulgariaBurkina FasoBurundiCabo VerdeCambodiaCameroonCanadaCaribbean small statesCentral African RepublicCentral Europe and the BalticsChadChileChinaColombiaComorosCongo, Dem. Rep.Congo, Rep.Costa RicaCote d'IvoireCroatiaCubaCyprusCzech RepublicDenmarkDjiboutiDominicaDominican RepublicEarly-demographic dividendEast Asia & PacificEast Asia & Pacific (excluding high income)East Asia & Pacific (IDA & IBRD countries)EcuadorEgypt, Arab Rep.El SalvadorEquatorial GuineaEritreaEstoniaEthiopiaEuro areaEurope & Central AsiaEurope & Central Asia (excluding high income)Europe & Central Asia (IDA & IBRD countries)European UnionFijiFinlandFragile and conflict affected situationsFranceFrench PolynesiaGabonGambia, TheGeorgiaGermanyGhanaGreeceGuatemalaGuineaGuinea-BissauGuyanaHaitiHeavily indebted poor countries (HIPC)High incomeHondurasHong Kong SAR, ChinaHungaryIBRD onlyIcelandIDA & IBRD totalIDA blendIDA onlyIDA totalIndiaIndonesiaIran, Islamic Rep.IraqIrelandIsraelItalyJamaicaJapanJordanKazakhstanKenyaKiribatiKorea, Rep.KuwaitKyrgyz RepublicLao PDRLate-demographic dividendLatin America & Caribbean Latin America & Caribbean (excluding high income)Latin America & the Caribbean (IDA & IBRD countries)LatviaLeast developed countries: UN classificationLebanonLesothoLiberiaLibyaLithuaniaLow & middle incomeLow incomeLower middle incomeLuxembourgMacedonia, FYRMadagascarMalawiMalaysiaMaldivesMaliMauritaniaMauritiusMexicoMicronesia, Fed. Sts.Middle East & North AfricaMiddle East & North Africa (excluding high income)Middle East & North Africa (IDA & IBRD countries)Middle incomeMoldovaMongoliaMoroccoMozambiqueMyanmarNamibiaNepalNetherlandsNew CaledoniaNew ZealandNicaraguaNigerNigeriaNorth AmericaNorwayOECD membersOmanOther small statesPacific island small statesPakistanPanamaPapua New GuineaParaguayPeruPhilippinesPolandPortugalPost-demographic dividendPre-demographic dividendQatarRomaniaRussian FederationRwandaSamoaSao Tome and PrincipeSaudi ArabiaSenegalSeychellesSierra LeoneSingaporeSlovak RepublicSloveniaSmall statesSolomon IslandsSomaliaSouth AfricaSouth AsiaSouth Asia (IDA & IBRD)SpainSri LankaSt. LuciaSt. Vincent and the GrenadinesSub-Saharan Africa Sub-Saharan Africa (excluding high income)Sub-Saharan Africa (IDA & IBRD countries)SudanSurinameSwazilandSwedenSwitzerlandSyrian Arab RepublicTajikistanTanzaniaThailandTogoTongaTrinidad and TobagoTunisiaTurkeyTurkmenistanUgandaUkraineUnited Arab EmiratesUnited KingdomUnited StatesUpper middle incomeUruguayUzbekistanVanuatuVenezuela, RBVietnamWorldYemen, Rep.ZambiaZimbabwe Timeline:
This timeline shows a graph from 1971 to 2015 of Thailand. No data until 1970. Number of actual observations by date: 45.
Source name:
World Development Indicators
Source organization:
World Bank staff estimates based on sources and methods in World Bank's "The Changing Wealth of Nations: Measuring Sustainable Development in the New Millennium" (2011).
Categories, topics:
Economy & Growth, Energy & Mining
Last updated:
apr 23, 2017
Indicators value changes by year
At the date of observation
Value
Absolute change
Change from previous value
jan 1, 1971
0.76
+0.76
0.0%
jan 1, 1972
0.64
-0.121
-15.89%
jan 1, 1973
0.778
+0.139
21.67%
jan 1, 1974
1.563
+0.785
100.83%
jan 1, 1975
1.489
-0.073
-4.7%
jan 1, 1976
0.982
-0.507
-34.06%
jan 1, 1977
0.905
-0.077
-7.83%
jan 1, 1978
1.098
+0.193
21.34%
jan 1, 1979
1.22
+0.122
11.07%
jan 1, 1980
1.257
+0.037
3.03%
jan 1, 1981
1.112
-0.145
-11.53%
jan 1, 1982
0.957
-0.155
-13.96%
jan 1, 1983
0.918
-0.039
-4.06%
jan 1, 1984
0.952
+0.034
3.69%
jan 1, 1985
1.031
+0.079
8.32%
jan 1, 1986
1.314
+0.283
27.45%
jan 1, 1987
1.084
-0.23
-17.5%
jan 1, 1988
0.986
-0.099
-9.09%
jan 1, 1989
1.047
+0.061
6.22%
jan 1, 1990
0.996
-0.051
-4.84%
jan 1, 1991
1.121
+0.125
12.52%
jan 1, 1992
1.001
-0.12
-10.69%
jan 1, 1993
1.045
+0.044
4.4%
jan 1, 1994
0.905
-0.141
-13.45%
jan 1, 1995
0.862
-0.043
-4.7%
jan 1, 1996
0.897
+0.035
4.06%
jan 1, 1997
1.128
+0.231
25.73%
jan 1, 1998
1.392
+0.264
23.42%
jan 1, 1999
1.383
-0.009
-0.67%
jan 1, 2000
1.176
-0.207
-14.99%
jan 1, 2001
2.482
+1.306
111.09%
jan 1, 2002
2.444
-0.038
-1.52%
jan 1, 2003
2.011
-0.433
-17.73%
jan 1, 2004
3.195
+1.185
58.92%
jan 1, 2005
3.088
-0.108
-3.37%
jan 1, 2006
4.539
+1.452
47.02%
jan 1, 2007
4.655
+0.116
2.55%
jan 1, 2008
4.468
-0.188
-4.03%
jan 1, 2009
6.161
+1.693
37.89%
jan 1, 2010
3.682
-2.479
-40.24%
jan 1, 2011
3.739
+0.058
1.56%
jan 1, 2012
3.726
-0.013
-0.35%
jan 1, 2013
3.804
+0.078
2.09%
jan 1, 2014
3.703
-0.101
-2.66%
jan 1, 2015
3.438
-0.265
-7.17%
Ranking of countries by current statistics by years


Comments: