29
/
en
AIzaSyAYiBZKx7MnpbEhh9jyipgxe19OcubqV5w
April 1, 2024
135168
Gabon
GAB
true
2
1
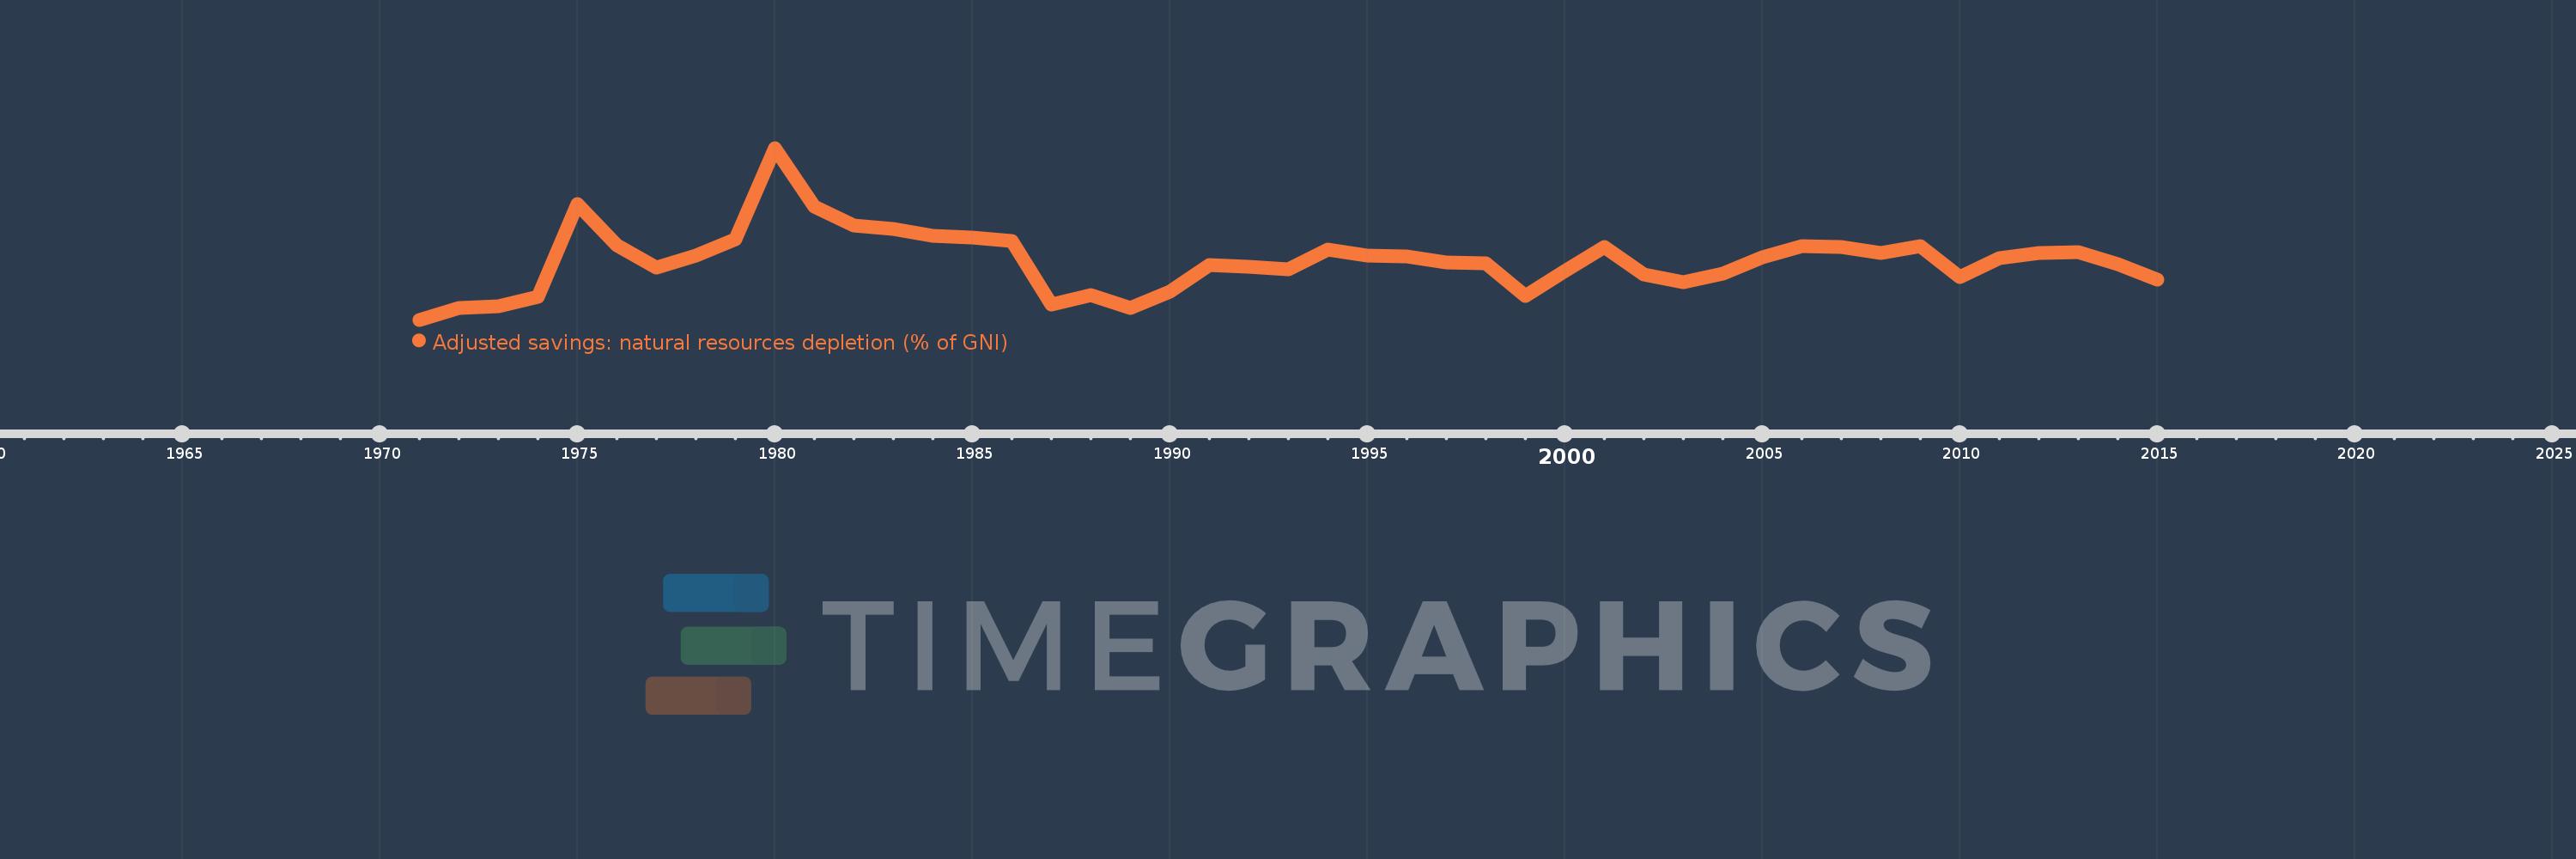
Adjusted savings: natural resources depletion (% of GNI)
2015,2014,2013,2012,2011,2010,2009,2008,2007,2006,2005,2004,2003,2002,2001,2000,1999,1998,1997,1996,1995,1994,1993,1992,1991,1990,1989,1988,1987,1986,1985,1984,1983,1982,1981,1980,1979,1978,1977,1976,1975,1974,1973,1972,1971
This statistics in other country:
AfghanistanAlbaniaAlgeriaAngolaArab WorldArgentinaArmeniaAustraliaAustriaAzerbaijanBahamas, TheBahrainBangladeshBarbadosBelarusBelgiumBelizeBeninBhutanBoliviaBotswanaBrazilBrunei DarussalamBulgariaBurkina FasoBurundiCabo VerdeCambodiaCameroonCanadaCaribbean small statesCentral African RepublicCentral Europe and the BalticsChadChileChinaColombiaComorosCongo, Dem. Rep.Congo, Rep.Costa RicaCote d'IvoireCroatiaCubaCyprusCzech RepublicDenmarkDjiboutiDominicaDominican RepublicEarly-demographic dividendEast Asia & PacificEast Asia & Pacific (excluding high income)East Asia & Pacific (IDA & IBRD countries)EcuadorEgypt, Arab Rep.El SalvadorEquatorial GuineaEritreaEstoniaEthiopiaEuro areaEurope & Central AsiaEurope & Central Asia (excluding high income)Europe & Central Asia (IDA & IBRD countries)European UnionFijiFinlandFragile and conflict affected situationsFranceFrench PolynesiaGabonGambia, TheGeorgiaGermanyGhanaGreeceGuatemalaGuineaGuinea-BissauGuyanaHaitiHeavily indebted poor countries (HIPC)High incomeHondurasHong Kong SAR, ChinaHungaryIBRD onlyIcelandIDA & IBRD totalIDA blendIDA onlyIDA totalIndiaIndonesiaIran, Islamic Rep.IraqIrelandIsraelItalyJamaicaJapanJordanKazakhstanKenyaKiribatiKorea, Rep.KuwaitKyrgyz RepublicLao PDRLate-demographic dividendLatin America & Caribbean Latin America & Caribbean (excluding high income)Latin America & the Caribbean (IDA & IBRD countries)LatviaLeast developed countries: UN classificationLebanonLesothoLiberiaLibyaLithuaniaLow & middle incomeLow incomeLower middle incomeLuxembourgMacedonia, FYRMadagascarMalawiMalaysiaMaldivesMaliMauritaniaMauritiusMexicoMicronesia, Fed. Sts.Middle East & North AfricaMiddle East & North Africa (excluding high income)Middle East & North Africa (IDA & IBRD countries)Middle incomeMoldovaMongoliaMoroccoMozambiqueMyanmarNamibiaNepalNetherlandsNew CaledoniaNew ZealandNicaraguaNigerNigeriaNorth AmericaNorwayOECD membersOmanOther small statesPacific island small statesPakistanPanamaPapua New GuineaParaguayPeruPhilippinesPolandPortugalPost-demographic dividendPre-demographic dividendQatarRomaniaRussian FederationRwandaSamoaSao Tome and PrincipeSaudi ArabiaSenegalSeychellesSierra LeoneSingaporeSlovak RepublicSloveniaSmall statesSolomon IslandsSomaliaSouth AfricaSouth AsiaSouth Asia (IDA & IBRD)SpainSri LankaSt. LuciaSt. Vincent and the GrenadinesSub-Saharan Africa Sub-Saharan Africa (excluding high income)Sub-Saharan Africa (IDA & IBRD countries)SudanSurinameSwazilandSwedenSwitzerlandSyrian Arab RepublicTajikistanTanzaniaThailandTogoTongaTrinidad and TobagoTunisiaTurkeyTurkmenistanUgandaUkraineUnited Arab EmiratesUnited KingdomUnited StatesUpper middle incomeUruguayUzbekistanVanuatuVenezuela, RBVietnamWorldYemen, Rep.ZambiaZimbabwe Timeline:
This timeline shows a graph from 1971 to 2015 of Gabon. No data until 1970. Number of actual observations by date: 45.
Source name:
World Development Indicators
Source organization:
World Bank staff estimates based on sources and methods in World Bank's "The Changing Wealth of Nations: Measuring Sustainable Development in the New Millennium" (2011).
Categories, topics:
Economy & Growth, Energy & Mining
Last updated:
apr 23, 2017
Indicators value changes by year
Minimum:
11.919
jan 1, 1971
Maximum:
72.487
jan 1, 1980
At the date of observation
Value
Absolute change
Change from previous value
jan 1, 1971
11.919
+11.919
0.0%
jan 1, 1972
16.13
+4.211
35.33%
jan 1, 1973
16.622
+0.491
3.05%
jan 1, 1974
20.103
+3.481
20.94%
jan 1, 1975
52.6
+32.497
161.66%
jan 1, 1976
38.3
-14.3
-27.19%
jan 1, 1977
30.277
-8.024
-20.95%
jan 1, 1978
34.682
+4.405
14.55%
jan 1, 1979
40.281
+5.6
16.15%
jan 1, 1980
72.487
+32.206
79.95%
jan 1, 1981
51.894
-20.593
-28.41%
jan 1, 1982
45.142
-6.752
-13.01%
jan 1, 1983
43.98
-1.161
-2.57%
jan 1, 1984
41.397
-2.583
-5.87%
jan 1, 1985
40.791
-0.607
-1.47%
jan 1, 1986
39.552
-1.238
-3.04%
jan 1, 1987
17.268
-22.284
-56.34%
jan 1, 1988
20.681
+3.412
19.76%
jan 1, 1989
16.098
-4.583
-22.16%
jan 1, 1990
21.911
+5.814
36.11%
jan 1, 1991
31.251
+9.339
42.62%
jan 1, 1992
30.654
-0.597
-1.91%
jan 1, 1993
29.554
-1.099
-3.59%
jan 1, 1994
36.668
+7.114
24.07%
jan 1, 1995
34.493
-2.174
-5.93%
jan 1, 1996
34.347
-0.147
-0.42%
jan 1, 1997
32.268
-2.079
-6.05%
jan 1, 1998
31.915
-0.353
-1.09%
jan 1, 1999
20.446
-11.469
-35.94%
jan 1, 2000
28.984
+8.538
41.76%
jan 1, 2001
37.634
+8.651
29.85%
jan 1, 2002
27.833
-9.802
-26.04%
jan 1, 2003
25.195
-2.638
-9.48%
jan 1, 2004
28.163
+2.968
11.78%
jan 1, 2005
34.079
+5.916
21.01%
jan 1, 2006
37.782
+3.702
10.86%
jan 1, 2007
37.692
-0.089
-0.24%
jan 1, 2008
35.599
-2.093
-5.55%
jan 1, 2009
37.801
+2.202
6.18%
jan 1, 2010
27.073
-10.728
-28.38%
jan 1, 2011
33.647
+6.573
24.28%
jan 1, 2012
35.502
+1.855
5.51%
jan 1, 2013
35.737
+0.235
0.66%
jan 1, 2014
31.589
-4.148
-11.61%
jan 1, 2015
26.159
-5.43
-17.19%
Ranking of countries by current statistics by years


Comments: