29
/
en
AIzaSyAYiBZKx7MnpbEhh9jyipgxe19OcubqV5w
April 1, 2024
34013
Fragile and conflict affected situations
FCS
false
2
1
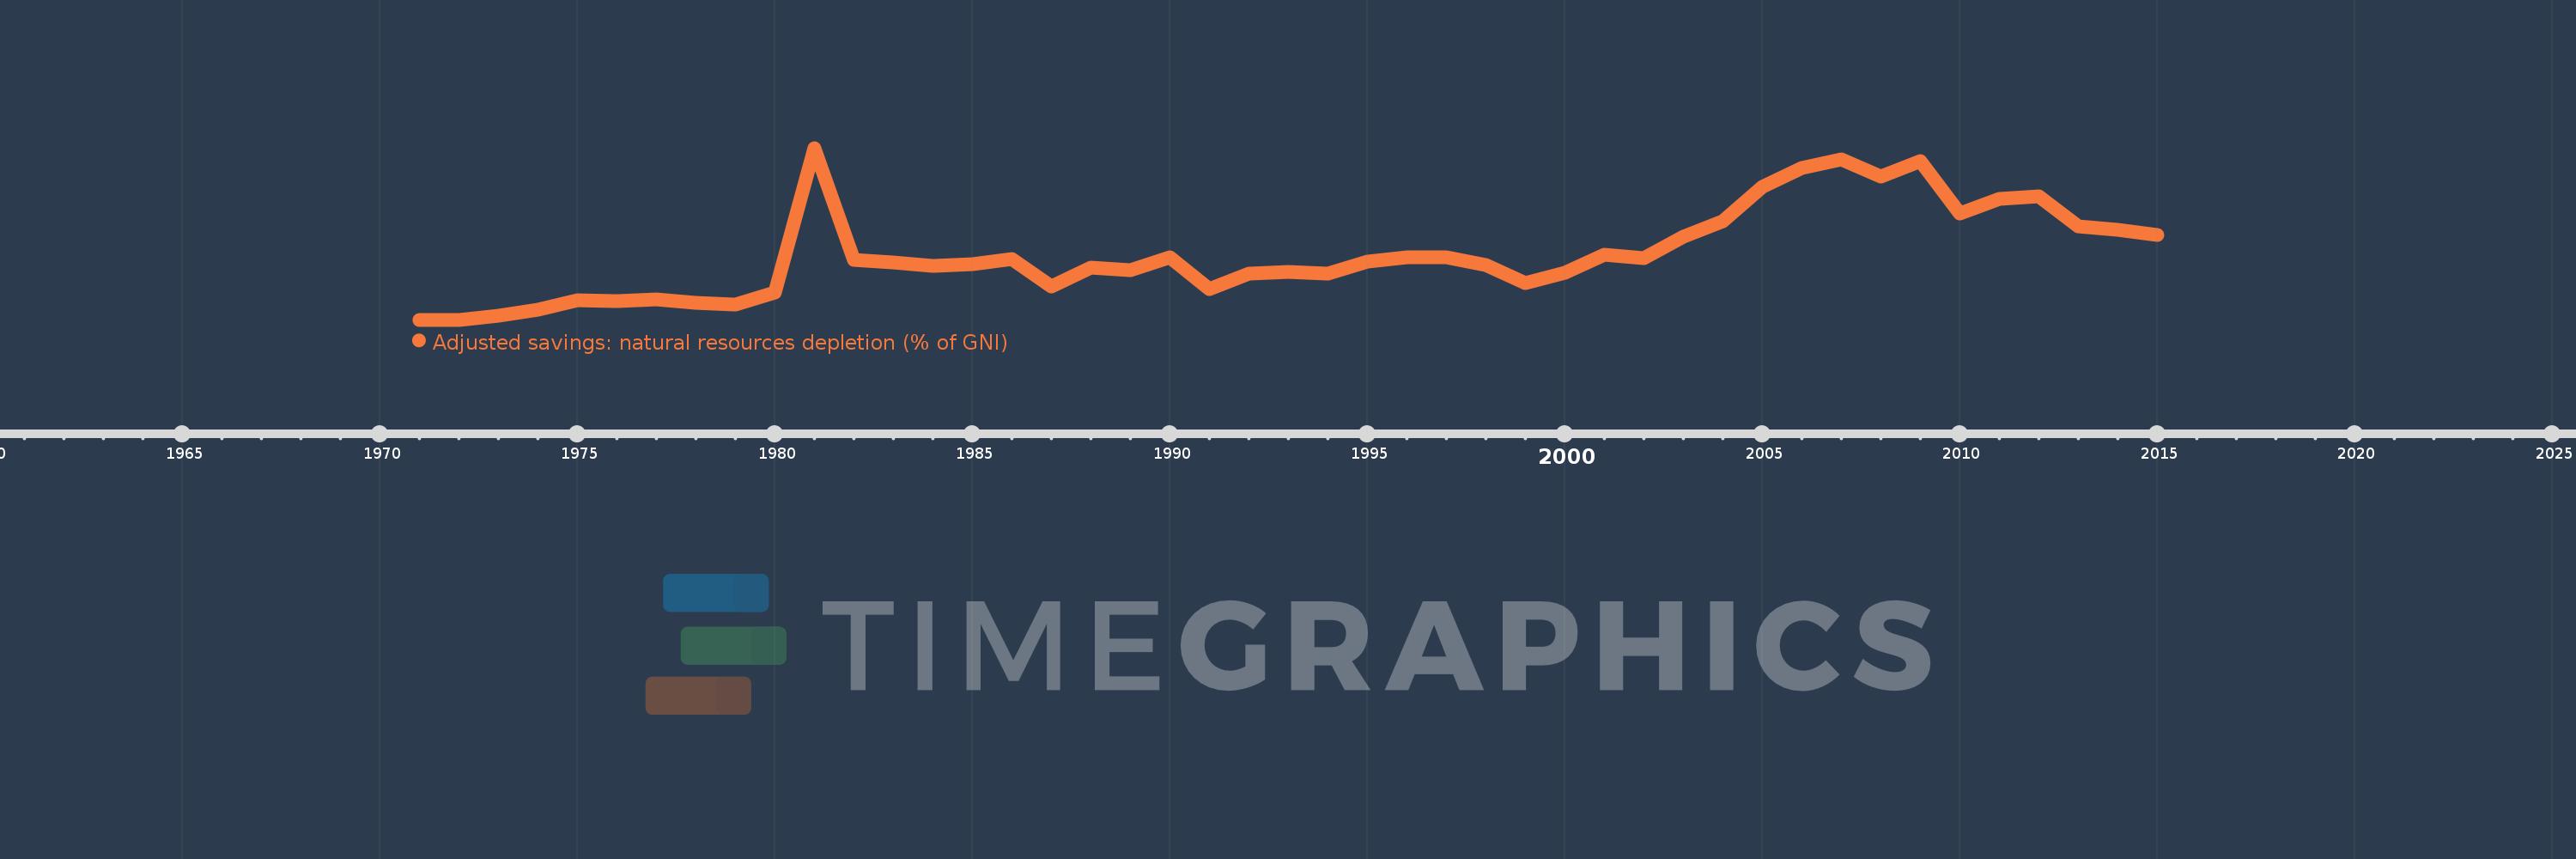
Adjusted savings: natural resources depletion (% of GNI)
2015,2014,2013,2012,2011,2010,2009,2008,2007,2006,2005,2004,2003,2002,2001,2000,1999,1998,1997,1996,1995,1994,1993,1992,1991,1990,1989,1988,1987,1986,1985,1984,1983,1982,1981,1980,1979,1978,1977,1976,1975,1974,1973,1972,1971
This statistics in other country:
AfghanistanAlbaniaAlgeriaAngolaArab WorldArgentinaArmeniaAustraliaAustriaAzerbaijanBahamas, TheBahrainBangladeshBarbadosBelarusBelgiumBelizeBeninBhutanBoliviaBotswanaBrazilBrunei DarussalamBulgariaBurkina FasoBurundiCabo VerdeCambodiaCameroonCanadaCaribbean small statesCentral African RepublicCentral Europe and the BalticsChadChileChinaColombiaComorosCongo, Dem. Rep.Congo, Rep.Costa RicaCote d'IvoireCroatiaCubaCyprusCzech RepublicDenmarkDjiboutiDominicaDominican RepublicEarly-demographic dividendEast Asia & PacificEast Asia & Pacific (excluding high income)East Asia & Pacific (IDA & IBRD countries)EcuadorEgypt, Arab Rep.El SalvadorEquatorial GuineaEritreaEstoniaEthiopiaEuro areaEurope & Central AsiaEurope & Central Asia (excluding high income)Europe & Central Asia (IDA & IBRD countries)European UnionFijiFinlandFragile and conflict affected situationsFranceFrench PolynesiaGabonGambia, TheGeorgiaGermanyGhanaGreeceGuatemalaGuineaGuinea-BissauGuyanaHaitiHeavily indebted poor countries (HIPC)High incomeHondurasHong Kong SAR, ChinaHungaryIBRD onlyIcelandIDA & IBRD totalIDA blendIDA onlyIDA totalIndiaIndonesiaIran, Islamic Rep.IraqIrelandIsraelItalyJamaicaJapanJordanKazakhstanKenyaKiribatiKorea, Rep.KuwaitKyrgyz RepublicLao PDRLate-demographic dividendLatin America & Caribbean Latin America & Caribbean (excluding high income)Latin America & the Caribbean (IDA & IBRD countries)LatviaLeast developed countries: UN classificationLebanonLesothoLiberiaLibyaLithuaniaLow & middle incomeLow incomeLower middle incomeLuxembourgMacedonia, FYRMadagascarMalawiMalaysiaMaldivesMaliMauritaniaMauritiusMexicoMicronesia, Fed. Sts.Middle East & North AfricaMiddle East & North Africa (excluding high income)Middle East & North Africa (IDA & IBRD countries)Middle incomeMoldovaMongoliaMoroccoMozambiqueMyanmarNamibiaNepalNetherlandsNew CaledoniaNew ZealandNicaraguaNigerNigeriaNorth AmericaNorwayOECD membersOmanOther small statesPacific island small statesPakistanPanamaPapua New GuineaParaguayPeruPhilippinesPolandPortugalPost-demographic dividendPre-demographic dividendQatarRomaniaRussian FederationRwandaSamoaSao Tome and PrincipeSaudi ArabiaSenegalSeychellesSierra LeoneSingaporeSlovak RepublicSloveniaSmall statesSolomon IslandsSomaliaSouth AfricaSouth AsiaSouth Asia (IDA & IBRD)SpainSri LankaSt. LuciaSt. Vincent and the GrenadinesSub-Saharan Africa Sub-Saharan Africa (excluding high income)Sub-Saharan Africa (IDA & IBRD countries)SudanSurinameSwazilandSwedenSwitzerlandSyrian Arab RepublicTajikistanTanzaniaThailandTogoTongaTrinidad and TobagoTunisiaTurkeyTurkmenistanUgandaUkraineUnited Arab EmiratesUnited KingdomUnited StatesUpper middle incomeUruguayUzbekistanVanuatuVenezuela, RBVietnamWorldYemen, Rep.ZambiaZimbabwe Timeline:
This timeline shows a graph from 1971 to 2015 of Fragile and conflict affected situations. No data until 1970. Number of actual observations by date: 45.
Source name:
World Development Indicators
Source organization:
World Bank staff estimates based on sources and methods in World Bank's "The Changing Wealth of Nations: Measuring Sustainable Development in the New Millennium" (2011).
Categories, topics:
Economy & Growth, Energy & Mining
Last updated:
apr 23, 2017
Indicators value changes by year
Maximum:
22.073
jan 1, 1981
At the date of observation
Value
Absolute change
Change from previous value
jan 1, 1971
1.024
+1.024
0.0%
jan 1, 1972
1.006
-0.018
-1.77%
jan 1, 1973
1.552
+0.546
54.23%
jan 1, 1974
2.186
+0.634
40.84%
jan 1, 1975
3.384
+1.199
54.86%
jan 1, 1976
3.316
-0.068
-2.01%
jan 1, 1977
3.455
+0.138
4.17%
jan 1, 1978
3.126
-0.328
-9.51%
jan 1, 1979
2.818
-0.308
-9.85%
jan 1, 1980
4.358
+1.54
54.64%
jan 1, 1981
22.073
+17.715
406.51%
jan 1, 1982
8.331
-13.742
-62.26%
jan 1, 1983
8.063
-0.268
-3.22%
jan 1, 1984
7.651
-0.413
-5.12%
jan 1, 1985
7.835
+0.185
2.42%
jan 1, 1986
8.46
+0.624
7.96%
jan 1, 1987
5.054
-3.405
-40.26%
jan 1, 1988
7.446
+2.392
47.33%
jan 1, 1989
7.035
-0.411
-5.52%
jan 1, 1990
8.643
+1.608
22.86%
jan 1, 1991
4.747
-3.897
-45.08%
jan 1, 1992
6.658
+1.911
40.27%
jan 1, 1993
6.828
+0.171
2.56%
jan 1, 1994
6.663
-0.165
-2.42%
jan 1, 1995
8.171
+1.507
22.62%
jan 1, 1996
8.713
+0.542
6.64%
jan 1, 1997
8.685
-0.028
-0.32%
jan 1, 1998
7.744
-0.941
-10.84%
jan 1, 1999
5.546
-2.198
-28.38%
jan 1, 2000
6.72
+1.174
21.17%
jan 1, 2001
9.015
+2.295
34.15%
jan 1, 2002
8.527
-0.488
-5.41%
jan 1, 2003
11.179
+2.651
31.09%
jan 1, 2004
13.043
+1.865
16.68%
jan 1, 2005
17.345
+4.302
32.98%
jan 1, 2006
19.609
+2.264
13.05%
jan 1, 2007
20.721
+1.111
5.67%
jan 1, 2008
18.595
-2.125
-10.26%
jan 1, 2009
20.44
+1.845
9.92%
jan 1, 2010
14.028
-6.412
-31.37%
jan 1, 2011
15.795
+1.767
12.59%
jan 1, 2012
16.179
+0.384
2.43%
jan 1, 2013
12.427
-3.752
-23.19%
jan 1, 2014
12.01
-0.417
-3.36%
jan 1, 2015
11.426
-0.584
-4.86%
Ranking of countries by current statistics by years


Comments: