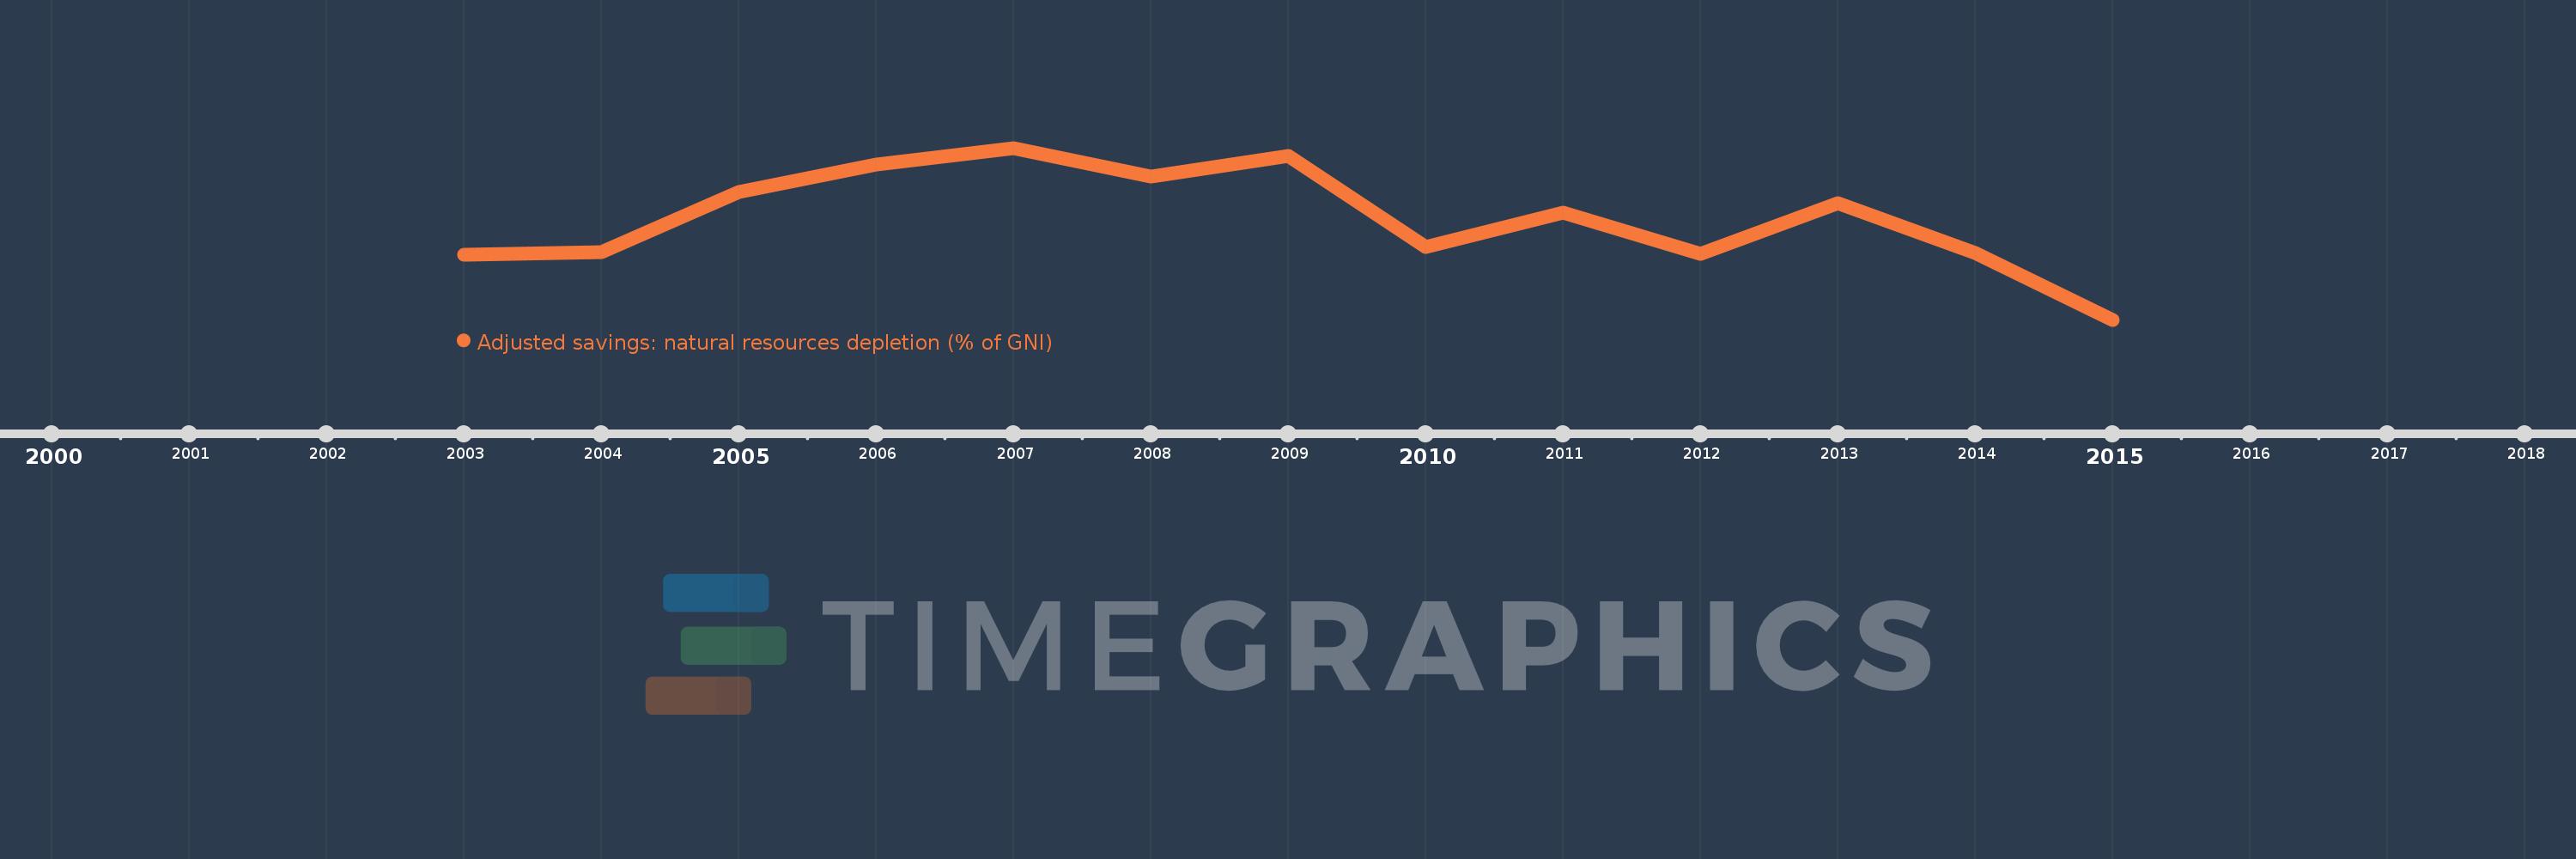
This timeline shows a graph from 2003 to 2015 of Libya. No data until 2002. Number of actual observations by date: 13.
Source name:
World Development Indicators
Source organization:
World Bank staff estimates based on sources and methods in World Bank's "The Changing Wealth of Nations: Measuring Sustainable Development in the New Millennium" (2011).
Categories, topics:
Economy & Growth, Energy & Mining
Last updated:
apr 23, 2017
Indicators value changes by year
Meaning:
25.541
Minimum:
16.201
jan 1, 2015
Maximum:
31.973
jan 1, 2007
At the date of observation
Value
Absolute change
Change from the previous value
jan 1, 2003
22.156
+22.156
0.0%
jan 1, 2004
22.374
+0.218
0.98%
jan 1, 2005
27.931
+5.557
24.84%
jan 1, 2006
30.427
+2.495
8.93%
jan 1, 2007
31.973
+1.546
5.08%
jan 1, 2008
29.338
-2.635
-8.24%
jan 1, 2009
31.211
+1.873
6.38%
jan 1, 2010
22.885
-8.326
-26.68%
jan 1, 2011
26.034
+3.149
13.76%
jan 1, 2012
22.233
-3.801
-14.6%
jan 1, 2013
26.937
+4.704
21.16%
jan 1, 2014
22.33
-4.607
-17.1%
jan 1, 2015
16.201
-6.129
-27.45%
Ranking of countries by current statistics by years
