29
/
en
AIzaSyAYiBZKx7MnpbEhh9jyipgxe19OcubqV5w
April 1, 2024
54538
Post-demographic dividend
PST
false
2
1
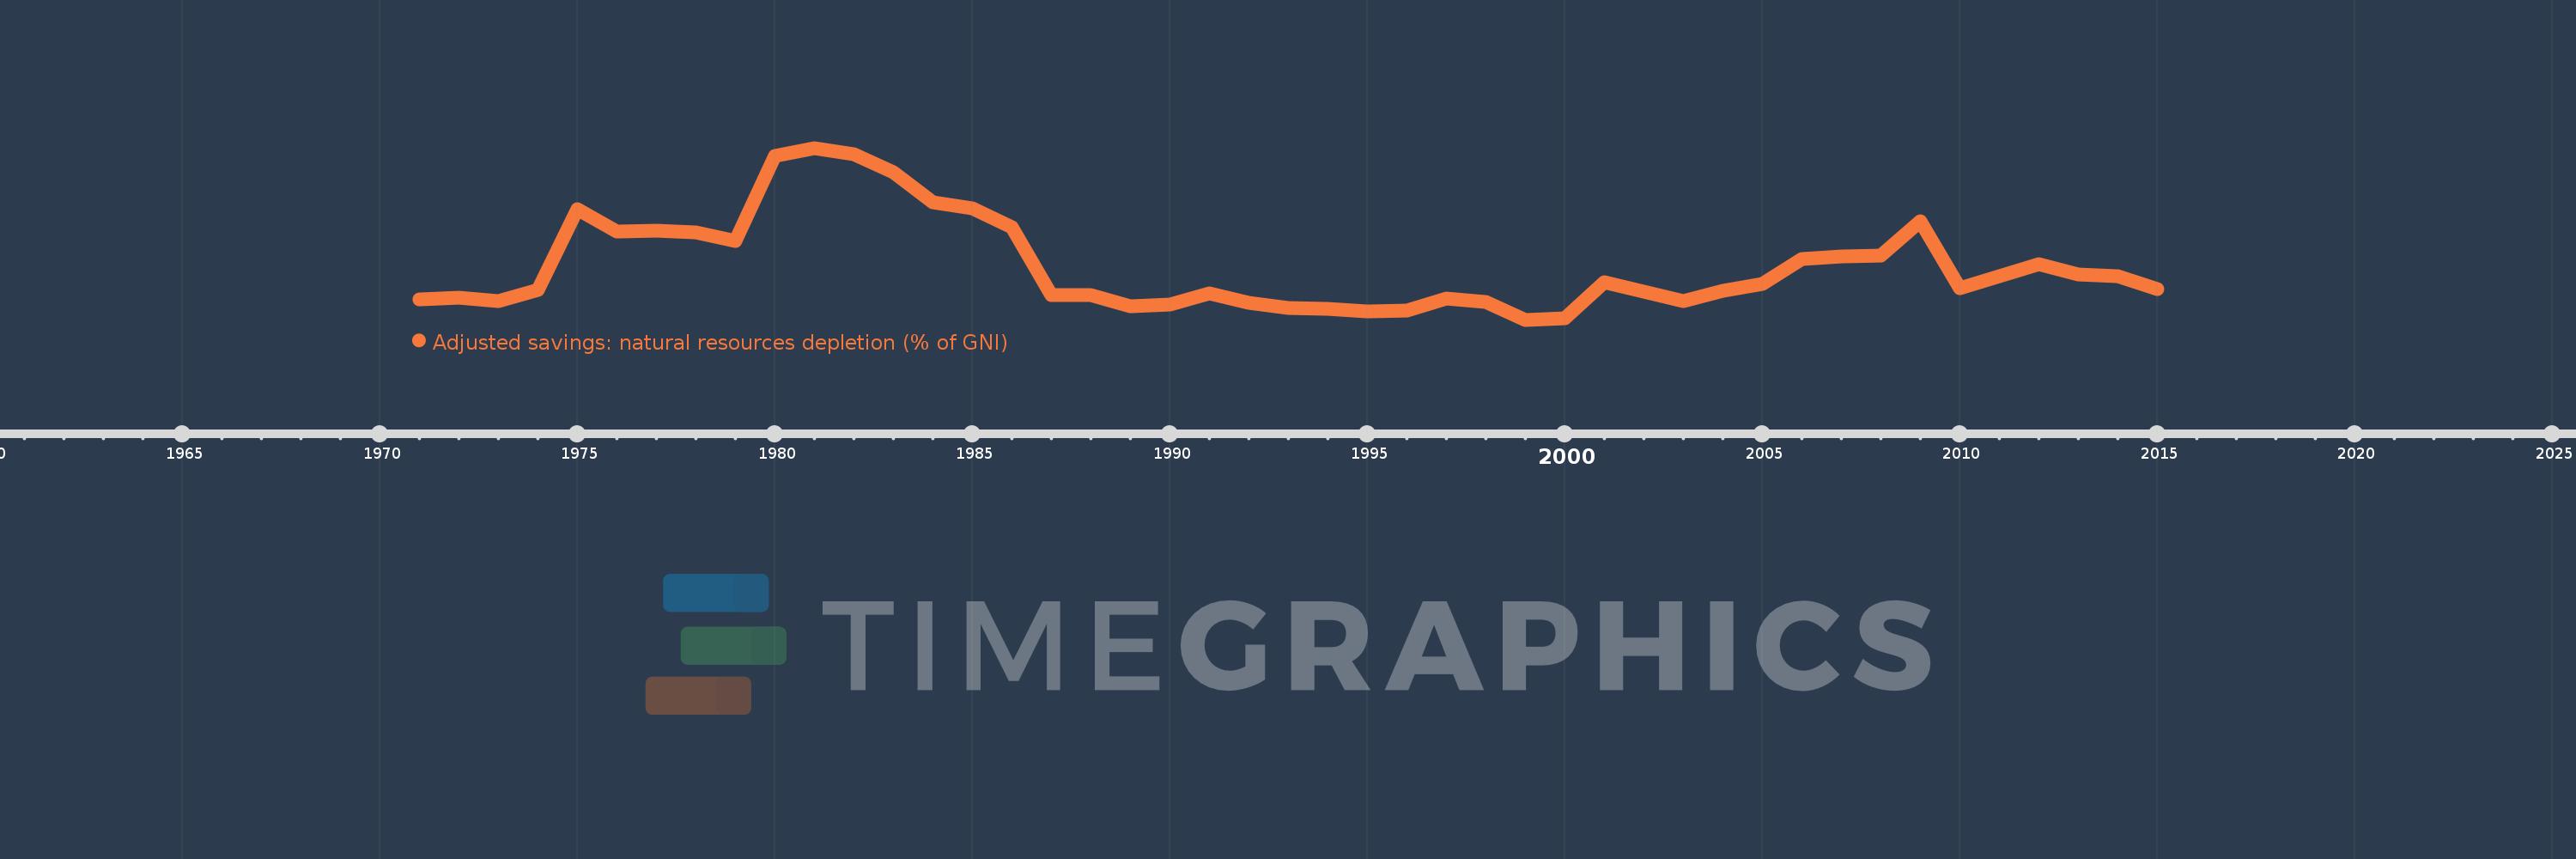
Adjusted savings: natural resources depletion (% of GNI)
2015,2014,2013,2012,2011,2010,2009,2008,2007,2006,2005,2004,2003,2002,2001,2000,1999,1998,1997,1996,1995,1994,1993,1992,1991,1990,1989,1988,1987,1986,1985,1984,1983,1982,1981,1980,1979,1978,1977,1976,1975,1974,1973,1972,1971
This statistics in other country:
AfghanistanAlbaniaAlgeriaAngolaArab WorldArgentinaArmeniaAustraliaAustriaAzerbaijanBahamas, TheBahrainBangladeshBarbadosBelarusBelgiumBelizeBeninBhutanBoliviaBotswanaBrazilBrunei DarussalamBulgariaBurkina FasoBurundiCabo VerdeCambodiaCameroonCanadaCaribbean small statesCentral African RepublicCentral Europe and the BalticsChadChileChinaColombiaComorosCongo, Dem. Rep.Congo, Rep.Costa RicaCote d'IvoireCroatiaCubaCyprusCzech RepublicDenmarkDjiboutiDominicaDominican RepublicEarly-demographic dividendEast Asia & PacificEast Asia & Pacific (excluding high income)East Asia & Pacific (IDA & IBRD countries)EcuadorEgypt, Arab Rep.El SalvadorEquatorial GuineaEritreaEstoniaEthiopiaEuro areaEurope & Central AsiaEurope & Central Asia (excluding high income)Europe & Central Asia (IDA & IBRD countries)European UnionFijiFinlandFragile and conflict affected situationsFranceFrench PolynesiaGabonGambia, TheGeorgiaGermanyGhanaGreeceGuatemalaGuineaGuinea-BissauGuyanaHaitiHeavily indebted poor countries (HIPC)High incomeHondurasHong Kong SAR, ChinaHungaryIBRD onlyIcelandIDA & IBRD totalIDA blendIDA onlyIDA totalIndiaIndonesiaIran, Islamic Rep.IraqIrelandIsraelItalyJamaicaJapanJordanKazakhstanKenyaKiribatiKorea, Rep.KuwaitKyrgyz RepublicLao PDRLate-demographic dividendLatin America & Caribbean Latin America & Caribbean (excluding high income)Latin America & the Caribbean (IDA & IBRD countries)LatviaLeast developed countries: UN classificationLebanonLesothoLiberiaLibyaLithuaniaLow & middle incomeLow incomeLower middle incomeLuxembourgMacedonia, FYRMadagascarMalawiMalaysiaMaldivesMaliMauritaniaMauritiusMexicoMicronesia, Fed. Sts.Middle East & North AfricaMiddle East & North Africa (excluding high income)Middle East & North Africa (IDA & IBRD countries)Middle incomeMoldovaMongoliaMoroccoMozambiqueMyanmarNamibiaNepalNetherlandsNew CaledoniaNew ZealandNicaraguaNigerNigeriaNorth AmericaNorwayOECD membersOmanOther small statesPacific island small statesPakistanPanamaPapua New GuineaParaguayPeruPhilippinesPolandPortugalPost-demographic dividendPre-demographic dividendQatarRomaniaRussian FederationRwandaSamoaSao Tome and PrincipeSaudi ArabiaSenegalSeychellesSierra LeoneSingaporeSlovak RepublicSloveniaSmall statesSolomon IslandsSomaliaSouth AfricaSouth AsiaSouth Asia (IDA & IBRD)SpainSri LankaSt. LuciaSt. Vincent and the GrenadinesSub-Saharan Africa Sub-Saharan Africa (excluding high income)Sub-Saharan Africa (IDA & IBRD countries)SudanSurinameSwazilandSwedenSwitzerlandSyrian Arab RepublicTajikistanTanzaniaThailandTogoTongaTrinidad and TobagoTunisiaTurkeyTurkmenistanUgandaUkraineUnited Arab EmiratesUnited KingdomUnited StatesUpper middle incomeUruguayUzbekistanVanuatuVenezuela, RBVietnamWorldYemen, Rep.ZambiaZimbabwe Timeline:
This timeline shows a graph from 1971 to 2015 of Post-demographic dividend. No data until 1970. Number of actual observations by date: 45.
Source name:
World Development Indicators
Source organization:
World Bank staff estimates based on sources and methods in World Bank's "The Changing Wealth of Nations: Measuring Sustainable Development in the New Millennium" (2011).
Categories, topics:
Economy & Growth, Energy & Mining
Last updated:
apr 23, 2017
Indicators value changes by year
At the date of observation
Value
Absolute change
Change from previous value
jan 1, 1971
0.49
+0.49
0.0%
jan 1, 1972
0.512
+0.022
4.57%
jan 1, 1973
0.47
-0.042
-8.2%
jan 1, 1974
0.609
+0.138
29.44%
jan 1, 1975
1.557
+0.948
155.69%
jan 1, 1976
1.29
-0.267
-17.15%
jan 1, 1977
1.307
+0.017
1.35%
jan 1, 1978
1.287
-0.02
-1.51%
jan 1, 1979
1.187
-0.1
-7.77%
jan 1, 1980
2.189
+1.002
84.4%
jan 1, 1981
2.279
+0.09
4.1%
jan 1, 1982
2.21
-0.069
-3.01%
jan 1, 1983
1.997
-0.213
-9.65%
jan 1, 1984
1.635
-0.362
-18.11%
jan 1, 1985
1.564
-0.072
-4.38%
jan 1, 1986
1.342
-0.222
-14.18%
jan 1, 1987
0.547
-0.795
-59.24%
jan 1, 1988
0.543
-0.004
-0.65%
jan 1, 1989
0.414
-0.129
-23.8%
jan 1, 1990
0.43
+0.016
3.8%
jan 1, 1991
0.56
+0.131
30.37%
jan 1, 1992
0.454
-0.107
-19.05%
jan 1, 1993
0.391
-0.063
-13.79%
jan 1, 1994
0.387
-0.004
-1.0%
jan 1, 1995
0.354
-0.033
-8.52%
jan 1, 1996
0.362
+0.008
2.13%
jan 1, 1997
0.502
+0.14
38.64%
jan 1, 1998
0.461
-0.041
-8.08%
jan 1, 1999
0.254
-0.207
-45.0%
jan 1, 2000
0.268
+0.014
5.5%
jan 1, 2001
0.695
+0.428
159.82%
jan 1, 2002
0.59
-0.105
-15.12%
jan 1, 2003
0.47
-0.12
-20.34%
jan 1, 2004
0.595
+0.125
26.66%
jan 1, 2005
0.68
+0.085
14.24%
jan 1, 2006
0.966
+0.286
42.1%
jan 1, 2007
0.999
+0.032
3.35%
jan 1, 2008
1.006
+0.007
0.71%
jan 1, 2009
1.411
+0.405
40.3%
jan 1, 2010
0.624
-0.787
-55.77%
jan 1, 2011
0.768
+0.144
23.04%
jan 1, 2012
0.908
+0.14
18.18%
jan 1, 2013
0.792
-0.116
-12.77%
jan 1, 2014
0.763
-0.028
-3.6%
jan 1, 2015
0.618
-0.145
-19.01%
Ranking of countries by current statistics by years


Comments: