29
/
en
AIzaSyAYiBZKx7MnpbEhh9jyipgxe19OcubqV5w
April 1, 2024
26270
Early-demographic dividend
EAR
false
2
1
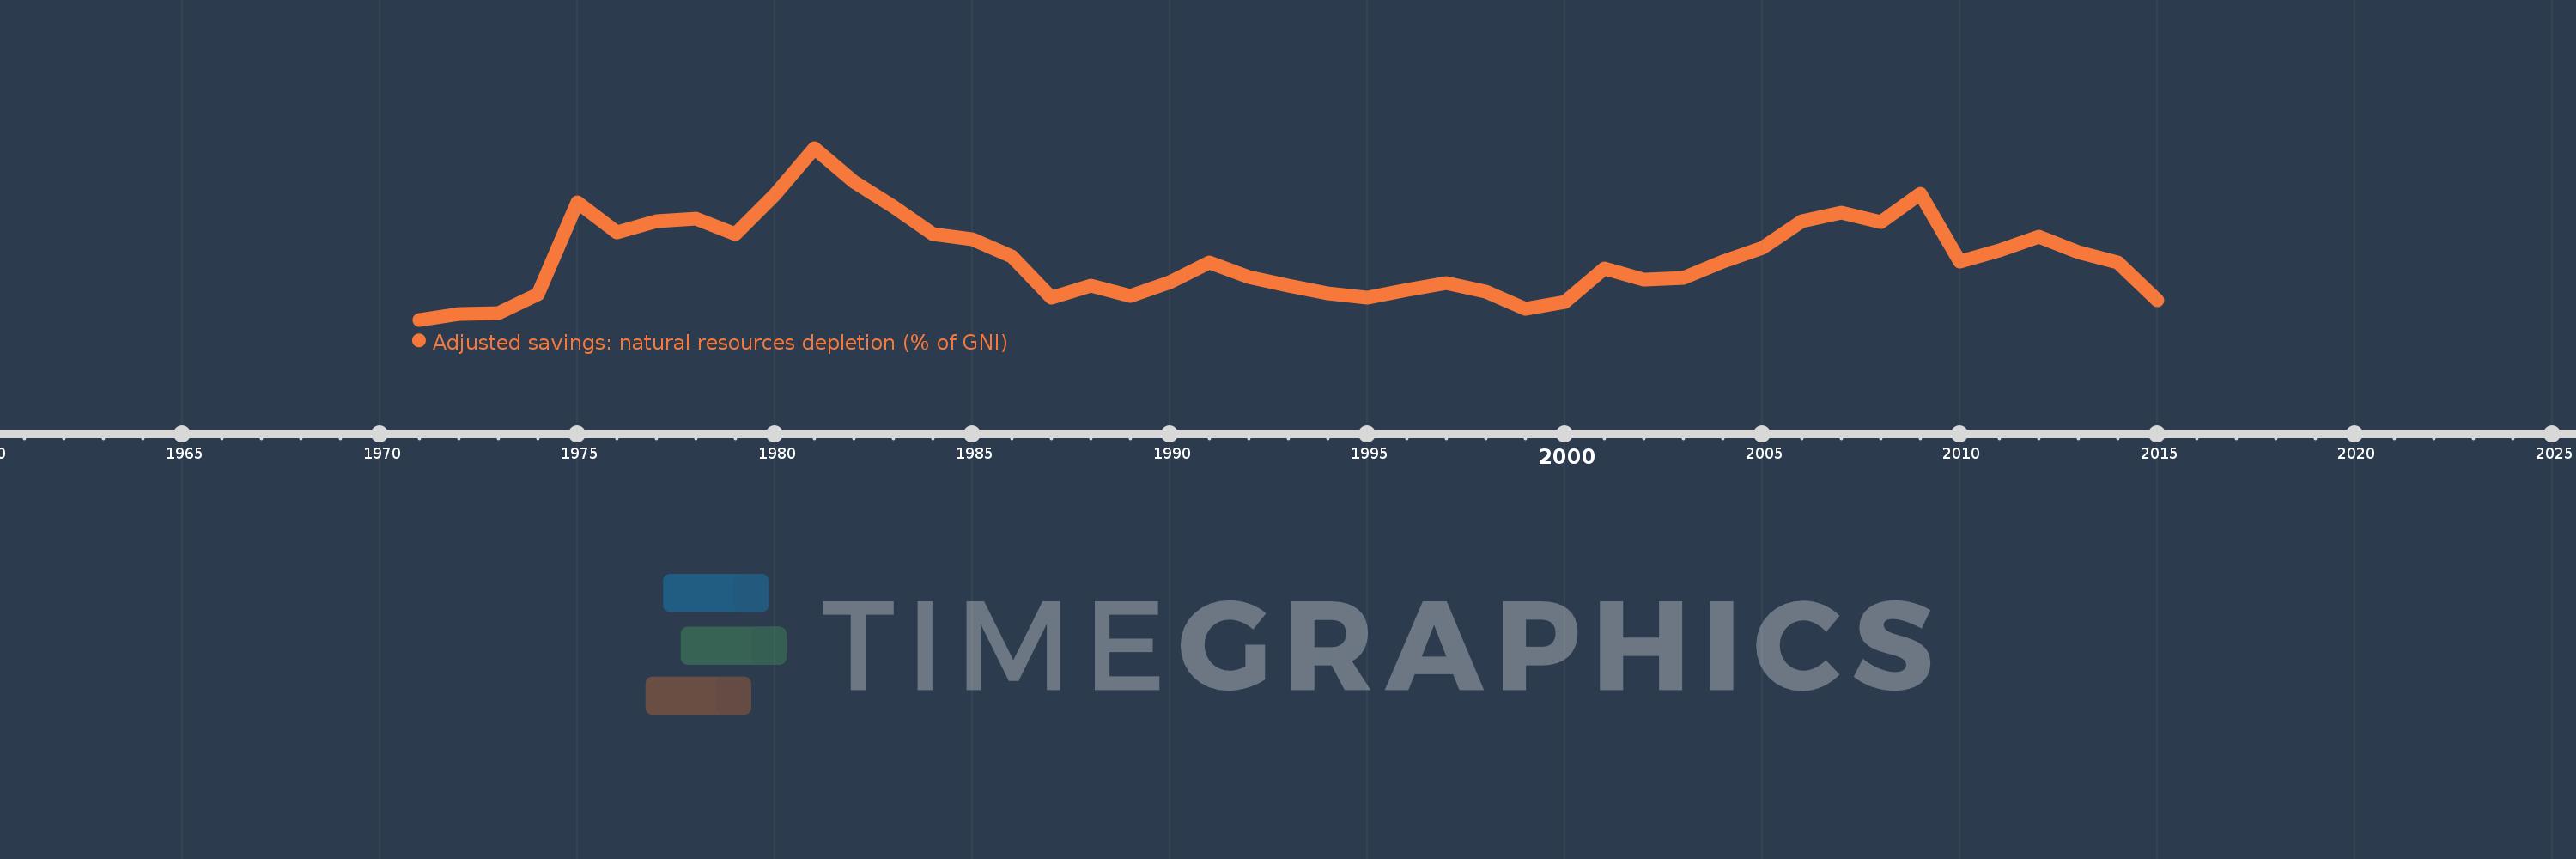
Adjusted savings: natural resources depletion (% of GNI)
2015,2014,2013,2012,2011,2010,2009,2008,2007,2006,2005,2004,2003,2002,2001,2000,1999,1998,1997,1996,1995,1994,1993,1992,1991,1990,1989,1988,1987,1986,1985,1984,1983,1982,1981,1980,1979,1978,1977,1976,1975,1974,1973,1972,1971
This statistics in other country:
AfghanistanAlbaniaAlgeriaAngolaArab WorldArgentinaArmeniaAustraliaAustriaAzerbaijanBahamas, TheBahrainBangladeshBarbadosBelarusBelgiumBelizeBeninBhutanBoliviaBotswanaBrazilBrunei DarussalamBulgariaBurkina FasoBurundiCabo VerdeCambodiaCameroonCanadaCaribbean small statesCentral African RepublicCentral Europe and the BalticsChadChileChinaColombiaComorosCongo, Dem. Rep.Congo, Rep.Costa RicaCote d'IvoireCroatiaCubaCyprusCzech RepublicDenmarkDjiboutiDominicaDominican RepublicEarly-demographic dividendEast Asia & PacificEast Asia & Pacific (excluding high income)East Asia & Pacific (IDA & IBRD countries)EcuadorEgypt, Arab Rep.El SalvadorEquatorial GuineaEritreaEstoniaEthiopiaEuro areaEurope & Central AsiaEurope & Central Asia (excluding high income)Europe & Central Asia (IDA & IBRD countries)European UnionFijiFinlandFragile and conflict affected situationsFranceFrench PolynesiaGabonGambia, TheGeorgiaGermanyGhanaGreeceGuatemalaGuineaGuinea-BissauGuyanaHaitiHeavily indebted poor countries (HIPC)High incomeHondurasHong Kong SAR, ChinaHungaryIBRD onlyIcelandIDA & IBRD totalIDA blendIDA onlyIDA totalIndiaIndonesiaIran, Islamic Rep.IraqIrelandIsraelItalyJamaicaJapanJordanKazakhstanKenyaKiribatiKorea, Rep.KuwaitKyrgyz RepublicLao PDRLate-demographic dividendLatin America & Caribbean Latin America & Caribbean (excluding high income)Latin America & the Caribbean (IDA & IBRD countries)LatviaLeast developed countries: UN classificationLebanonLesothoLiberiaLibyaLithuaniaLow & middle incomeLow incomeLower middle incomeLuxembourgMacedonia, FYRMadagascarMalawiMalaysiaMaldivesMaliMauritaniaMauritiusMexicoMicronesia, Fed. Sts.Middle East & North AfricaMiddle East & North Africa (excluding high income)Middle East & North Africa (IDA & IBRD countries)Middle incomeMoldovaMongoliaMoroccoMozambiqueMyanmarNamibiaNepalNetherlandsNew CaledoniaNew ZealandNicaraguaNigerNigeriaNorth AmericaNorwayOECD membersOmanOther small statesPacific island small statesPakistanPanamaPapua New GuineaParaguayPeruPhilippinesPolandPortugalPost-demographic dividendPre-demographic dividendQatarRomaniaRussian FederationRwandaSamoaSao Tome and PrincipeSaudi ArabiaSenegalSeychellesSierra LeoneSingaporeSlovak RepublicSloveniaSmall statesSolomon IslandsSomaliaSouth AfricaSouth AsiaSouth Asia (IDA & IBRD)SpainSri LankaSt. LuciaSt. Vincent and the GrenadinesSub-Saharan Africa Sub-Saharan Africa (excluding high income)Sub-Saharan Africa (IDA & IBRD countries)SudanSurinameSwazilandSwedenSwitzerlandSyrian Arab RepublicTajikistanTanzaniaThailandTogoTongaTrinidad and TobagoTunisiaTurkeyTurkmenistanUgandaUkraineUnited Arab EmiratesUnited KingdomUnited StatesUpper middle incomeUruguayUzbekistanVanuatuVenezuela, RBVietnamWorldYemen, Rep.ZambiaZimbabwe Timeline:
This timeline shows a graph from 1971 to 2015 of Early-demographic dividend. No data until 1970. Number of actual observations by date: 45.
Source name:
World Development Indicators
Source organization:
World Bank staff estimates based on sources and methods in World Bank's "The Changing Wealth of Nations: Measuring Sustainable Development in the New Millennium" (2011).
Categories, topics:
Economy & Growth, Energy & Mining
Last updated:
apr 23, 2017
Indicators value changes by year
Maximum:
13.308
jan 1, 1981
At the date of observation
Value
Absolute change
Change from previous value
jan 1, 1971
2.325
+2.325
0.0%
jan 1, 1972
2.677
+0.352
15.14%
jan 1, 1973
2.752
+0.075
2.8%
jan 1, 1974
3.97
+1.219
44.28%
jan 1, 1975
9.827
+5.857
147.52%
jan 1, 1976
7.924
-1.903
-19.36%
jan 1, 1977
8.632
+0.708
8.94%
jan 1, 1978
8.804
+0.172
1.99%
jan 1, 1979
7.795
-1.009
-11.46%
jan 1, 1980
10.318
+2.523
32.37%
jan 1, 1981
13.308
+2.989
28.97%
jan 1, 1982
11.123
-2.184
-16.41%
jan 1, 1983
9.582
-1.541
-13.86%
jan 1, 1984
7.809
-1.773
-18.5%
jan 1, 1985
7.478
-0.331
-4.23%
jan 1, 1986
6.352
-1.126
-15.06%
jan 1, 1987
3.715
-2.637
-41.52%
jan 1, 1988
4.524
+0.809
21.78%
jan 1, 1989
3.862
-0.662
-14.64%
jan 1, 1990
4.699
+0.837
21.67%
jan 1, 1991
5.983
+1.284
27.33%
jan 1, 1992
5.047
-0.936
-15.64%
jan 1, 1993
4.491
-0.556
-11.02%
jan 1, 1994
3.99
-0.5
-11.14%
jan 1, 1995
3.737
-0.253
-6.34%
jan 1, 1996
4.212
+0.475
12.7%
jan 1, 1997
4.66
+0.448
10.64%
jan 1, 1998
4.138
-0.522
-11.2%
jan 1, 1999
3.021
-1.118
-27.01%
jan 1, 2000
3.466
+0.445
14.73%
jan 1, 2001
5.604
+2.138
61.7%
jan 1, 2002
4.903
-0.701
-12.5%
jan 1, 2003
5.022
+0.118
2.42%
jan 1, 2004
6.037
+1.015
20.22%
jan 1, 2005
6.943
+0.906
15.01%
jan 1, 2006
8.621
+1.678
24.17%
jan 1, 2007
9.18
+0.559
6.48%
jan 1, 2008
8.561
-0.619
-6.74%
jan 1, 2009
10.376
+1.816
21.21%
jan 1, 2010
6.043
-4.334
-41.76%
jan 1, 2011
6.759
+0.716
11.85%
jan 1, 2012
7.645
+0.886
13.11%
jan 1, 2013
6.654
-0.992
-12.97%
jan 1, 2014
6.013
-0.64
-9.62%
jan 1, 2015
3.597
-2.416
-40.18%
Ranking of countries by current statistics by years


Comments: