29
/
en
AIzaSyAYiBZKx7MnpbEhh9jyipgxe19OcubqV5w
April 1, 2024
110549
Congo, Rep.
COG
true
2
1
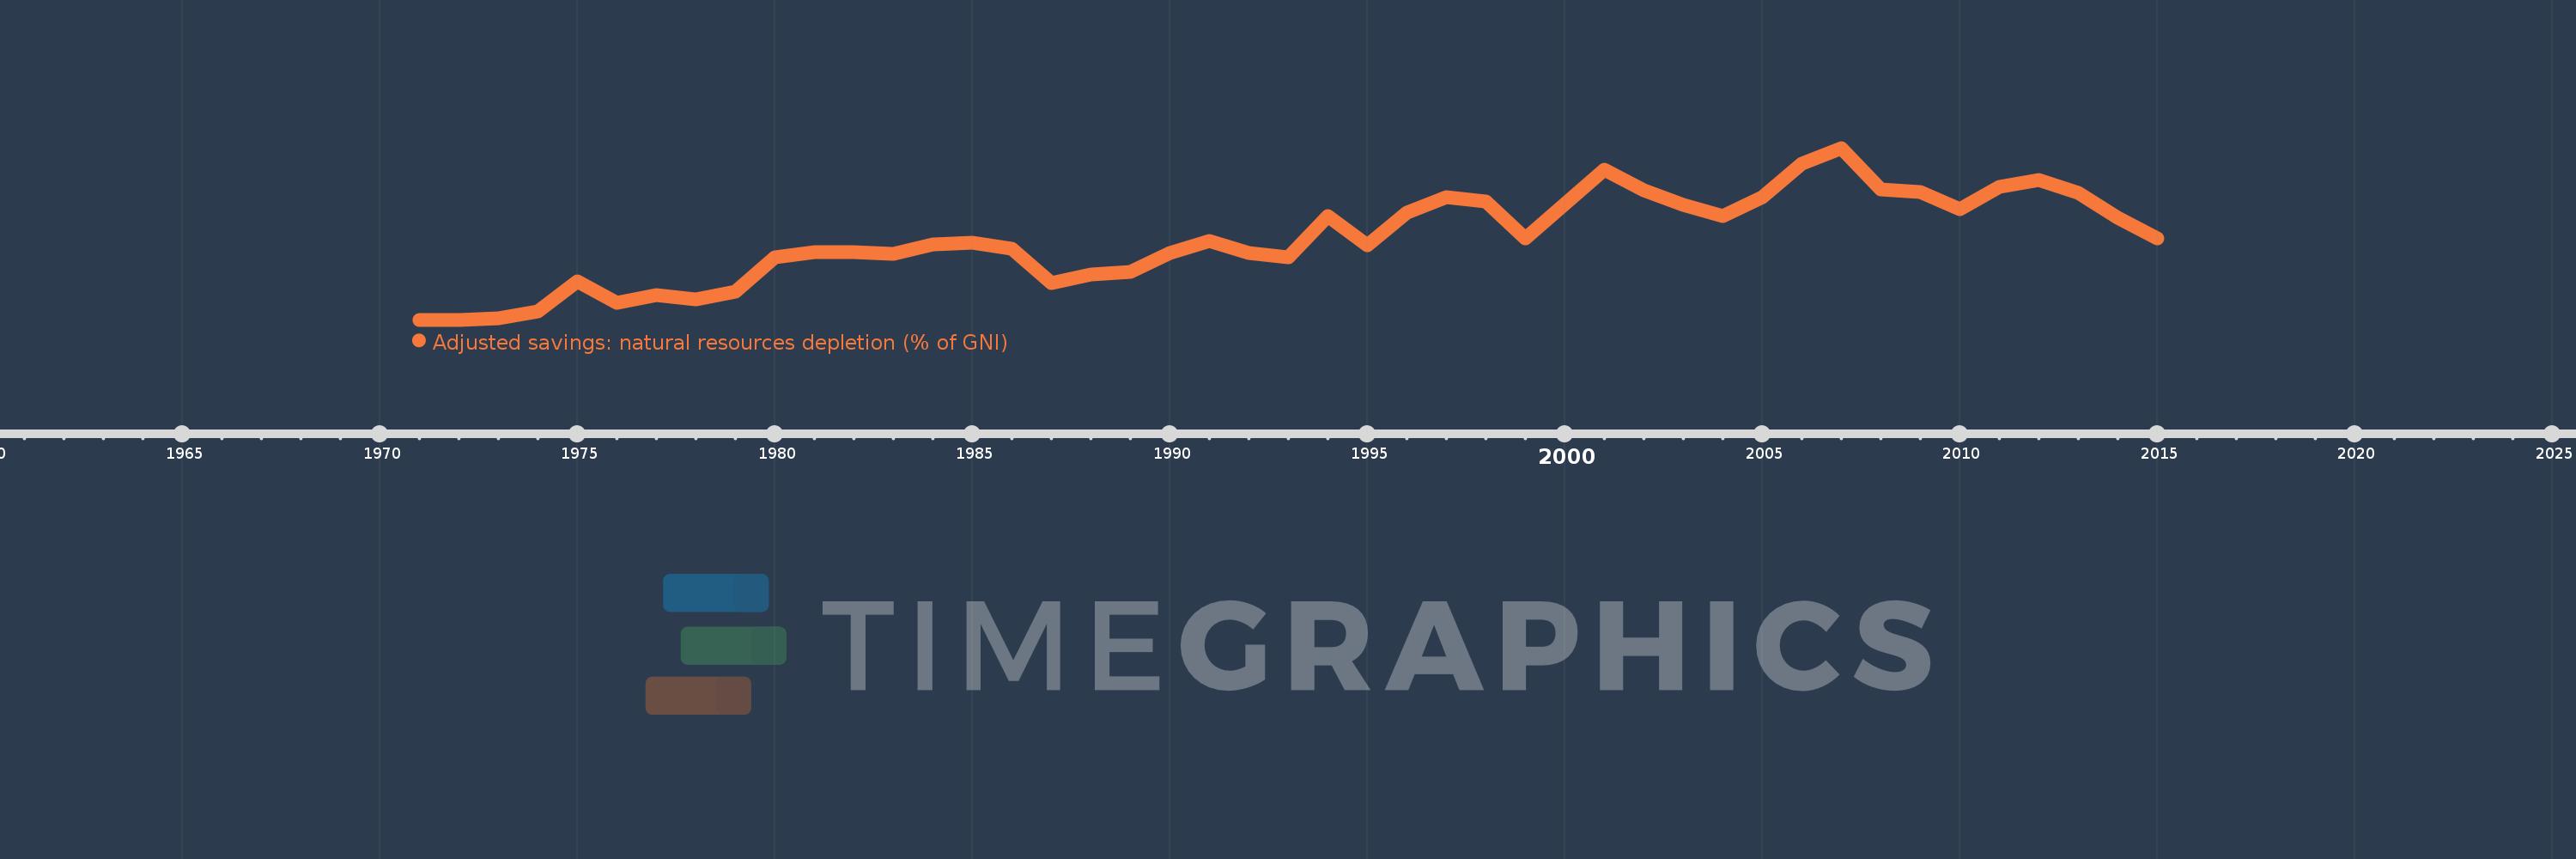
Adjusted savings: natural resources depletion (% of GNI)
2015,2014,2013,2012,2011,2010,2009,2008,2007,2006,2005,2004,2003,2002,2001,2000,1999,1998,1997,1996,1995,1994,1993,1992,1991,1990,1989,1988,1987,1986,1985,1984,1983,1982,1981,1980,1979,1978,1977,1976,1975,1974,1973,1972,1971
This statistics in other country:
AfghanistanAlbaniaAlgeriaAngolaArab WorldArgentinaArmeniaAustraliaAustriaAzerbaijanBahamas, TheBahrainBangladeshBarbadosBelarusBelgiumBelizeBeninBhutanBoliviaBotswanaBrazilBrunei DarussalamBulgariaBurkina FasoBurundiCabo VerdeCambodiaCameroonCanadaCaribbean small statesCentral African RepublicCentral Europe and the BalticsChadChileChinaColombiaComorosCongo, Dem. Rep.Congo, Rep.Costa RicaCote d'IvoireCroatiaCubaCyprusCzech RepublicDenmarkDjiboutiDominicaDominican RepublicEarly-demographic dividendEast Asia & PacificEast Asia & Pacific (excluding high income)East Asia & Pacific (IDA & IBRD countries)EcuadorEgypt, Arab Rep.El SalvadorEquatorial GuineaEritreaEstoniaEthiopiaEuro areaEurope & Central AsiaEurope & Central Asia (excluding high income)Europe & Central Asia (IDA & IBRD countries)European UnionFijiFinlandFragile and conflict affected situationsFranceFrench PolynesiaGabonGambia, TheGeorgiaGermanyGhanaGreeceGuatemalaGuineaGuinea-BissauGuyanaHaitiHeavily indebted poor countries (HIPC)High incomeHondurasHong Kong SAR, ChinaHungaryIBRD onlyIcelandIDA & IBRD totalIDA blendIDA onlyIDA totalIndiaIndonesiaIran, Islamic Rep.IraqIrelandIsraelItalyJamaicaJapanJordanKazakhstanKenyaKiribatiKorea, Rep.KuwaitKyrgyz RepublicLao PDRLate-demographic dividendLatin America & Caribbean Latin America & Caribbean (excluding high income)Latin America & the Caribbean (IDA & IBRD countries)LatviaLeast developed countries: UN classificationLebanonLesothoLiberiaLibyaLithuaniaLow & middle incomeLow incomeLower middle incomeLuxembourgMacedonia, FYRMadagascarMalawiMalaysiaMaldivesMaliMauritaniaMauritiusMexicoMicronesia, Fed. Sts.Middle East & North AfricaMiddle East & North Africa (excluding high income)Middle East & North Africa (IDA & IBRD countries)Middle incomeMoldovaMongoliaMoroccoMozambiqueMyanmarNamibiaNepalNetherlandsNew CaledoniaNew ZealandNicaraguaNigerNigeriaNorth AmericaNorwayOECD membersOmanOther small statesPacific island small statesPakistanPanamaPapua New GuineaParaguayPeruPhilippinesPolandPortugalPost-demographic dividendPre-demographic dividendQatarRomaniaRussian FederationRwandaSamoaSao Tome and PrincipeSaudi ArabiaSenegalSeychellesSierra LeoneSingaporeSlovak RepublicSloveniaSmall statesSolomon IslandsSomaliaSouth AfricaSouth AsiaSouth Asia (IDA & IBRD)SpainSri LankaSt. LuciaSt. Vincent and the GrenadinesSub-Saharan Africa Sub-Saharan Africa (excluding high income)Sub-Saharan Africa (IDA & IBRD countries)SudanSurinameSwazilandSwedenSwitzerlandSyrian Arab RepublicTajikistanTanzaniaThailandTogoTongaTrinidad and TobagoTunisiaTurkeyTurkmenistanUgandaUkraineUnited Arab EmiratesUnited KingdomUnited StatesUpper middle incomeUruguayUzbekistanVanuatuVenezuela, RBVietnamWorldYemen, Rep.ZambiaZimbabwe Timeline:
This timeline shows a graph from 1971 to 2015 of Congo, Rep.. No data until 1970. Number of actual observations by date: 45.
Source name:
World Development Indicators
Source organization:
World Bank staff estimates based on sources and methods in World Bank's "The Changing Wealth of Nations: Measuring Sustainable Development in the New Millennium" (2011).
Categories, topics:
Economy & Growth, Energy & Mining
Last updated:
apr 23, 2017
Indicators value changes by year
Maximum:
83.015
jan 1, 2007
At the date of observation
Value
Absolute change
Change from previous value
jan 1, 1971
0.05
+0.05
0.0%
jan 1, 1972
0.093
+0.043
84.66%
jan 1, 1973
0.603
+0.51
548.96%
jan 1, 1974
4.243
+3.64
603.44%
jan 1, 1975
18.585
+14.342
337.97%
jan 1, 1976
8.396
-10.19
-54.83%
jan 1, 1977
11.756
+3.361
40.03%
jan 1, 1978
9.78
-1.976
-16.81%
jan 1, 1979
13.754
+3.974
40.63%
jan 1, 1980
30.257
+16.502
119.98%
jan 1, 1981
32.639
+2.383
7.87%
jan 1, 1982
32.879
+0.239
0.73%
jan 1, 1983
31.719
-1.16
-3.53%
jan 1, 1984
36.569
+4.85
15.29%
jan 1, 1985
37.221
+0.653
1.78%
jan 1, 1986
34.504
-2.717
-7.3%
jan 1, 1987
17.798
-16.706
-48.42%
jan 1, 1988
21.763
+3.965
22.28%
jan 1, 1989
23.011
+1.248
5.73%
jan 1, 1990
32.369
+9.358
40.66%
jan 1, 1991
38.002
+5.633
17.4%
jan 1, 1992
32.378
-5.624
-14.8%
jan 1, 1993
30.333
-2.045
-6.32%
jan 1, 1994
50.125
+19.793
65.25%
jan 1, 1995
36.196
-13.929
-27.79%
jan 1, 1996
51.896
+15.7
43.37%
jan 1, 1997
59.156
+7.26
13.99%
jan 1, 1998
57.171
-1.985
-3.36%
jan 1, 1999
39.239
-17.932
-31.37%
jan 1, 2000
56.119
+16.88
43.02%
jan 1, 2001
72.677
+16.558
29.5%
jan 1, 2002
62.421
-10.256
-14.11%
jan 1, 2003
55.632
-6.789
-10.88%
jan 1, 2004
50.234
-5.398
-9.7%
jan 1, 2005
59.308
+9.073
18.06%
jan 1, 2006
75.442
+16.135
27.2%
jan 1, 2007
83.015
+7.573
10.04%
jan 1, 2008
63.059
-19.956
-24.04%
jan 1, 2009
61.858
-1.201
-1.9%
jan 1, 2010
53.618
-8.24
-13.32%
jan 1, 2011
64.427
+10.809
20.16%
jan 1, 2012
67.709
+3.282
5.09%
jan 1, 2013
61.52
-6.189
-9.14%
jan 1, 2014
49.435
-12.085
-19.64%
jan 1, 2015
39.249
-10.186
-20.6%
Ranking of countries by current statistics by years


Comments: