29
/
en
AIzaSyAYiBZKx7MnpbEhh9jyipgxe19OcubqV5w
April 1, 2024
74171
Austria
AUT
true
2
1
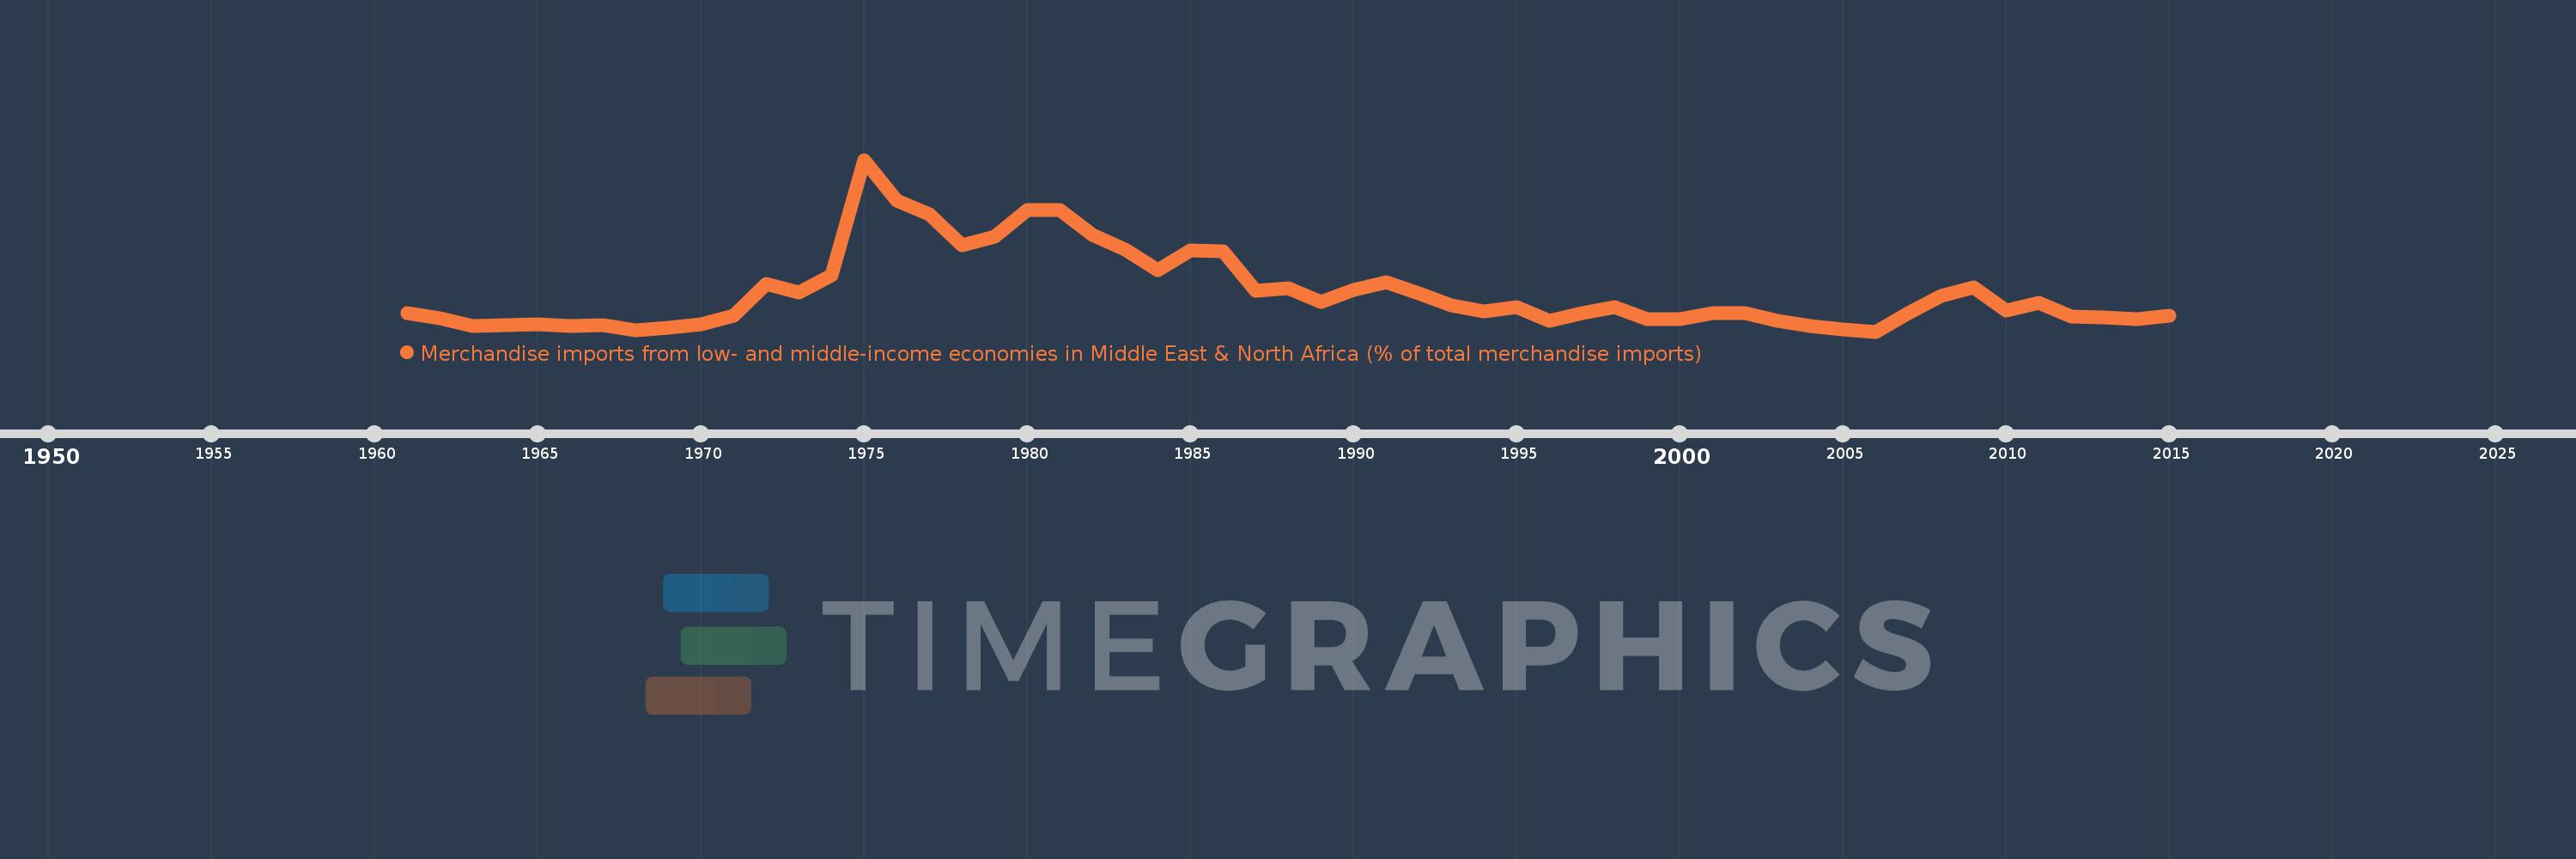
Merchandise imports from low- and middle-income economies in Middle East & North Africa (% of total merchandise imports)
2015,2014,2013,2012,2011,2010,2009,2008,2007,2006,2005,2004,2003,2002,2001,2000,1999,1998,1997,1996,1995,1994,1993,1992,1991,1990,1989,1988,1987,1986,1985,1984,1983,1982,1981,1980,1979,1978,1977,1976,1975,1974,1973,1972,1971,1970,1969,1968,1967,1966,1965,1964,1963,1962,1961
This statistics in other country:
AfghanistanAlbaniaAlgeriaAngolaArab WorldArgentinaArmeniaArubaAustraliaAustriaAzerbaijanBahamas, TheBahrainBangladeshBarbadosBelarusBelgiumBelizeBeninBermudaBoliviaBosnia and HerzegovinaBrazilBrunei DarussalamBulgariaBurkina FasoBurundiCabo VerdeCambodiaCameroonCanadaCaribbean small statesCentral African RepublicCentral Europe and the BalticsChadChileChinaColombiaComorosCongo, Dem. Rep.Congo, Rep.Costa RicaCote d'IvoireCroatiaCubaCyprusCzech RepublicDenmarkDjiboutiDominicaDominican RepublicEarly-demographic dividendEast Asia & PacificEast Asia & Pacific (excluding high income)East Asia & Pacific (IDA & IBRD countries)EcuadorEgypt, Arab Rep.El SalvadorEstoniaEthiopiaEuro areaEurope & Central AsiaEurope & Central Asia (excluding high income)Europe & Central Asia (IDA & IBRD countries)European UnionFijiFinlandFragile and conflict affected situationsFranceFrench PolynesiaGabonGambia, TheGeorgiaGermanyGhanaGreeceGreenlandGrenadaGuatemalaGuineaGuinea-BissauGuyanaHaitiHeavily indebted poor countries (HIPC)High incomeHondurasHong Kong SAR, ChinaHungaryIBRD onlyIcelandIDA & IBRD totalIDA blendIDA onlyIDA totalIndiaIndonesiaIran, Islamic Rep.IraqIrelandIsraelItalyJamaicaJapanJordanKazakhstanKenyaKorea, Dem. People’s Rep.Korea, Rep.KosovoKuwaitKyrgyz RepublicLao PDRLate-demographic dividendLatin America & Caribbean Latin America & Caribbean (excluding high income)Latin America & the Caribbean (IDA & IBRD countries)LatviaLeast developed countries: UN classificationLebanonLiberiaLibyaLithuaniaLow & middle incomeLow incomeLower middle incomeLuxembourgMacao SAR, ChinaMacedonia, FYRMadagascarMalawiMalaysiaMaldivesMaliMaltaMauritaniaMauritiusMexicoMiddle East & North AfricaMiddle East & North Africa (excluding high income)Middle East & North Africa (IDA & IBRD countries)Middle incomeMoldovaMongoliaMontenegroMoroccoMozambiqueMyanmarNepalNetherlandsNew CaledoniaNew ZealandNicaraguaNigerNigeriaNorth AmericaNorwayOECD membersOmanOther small statesPacific island small statesPakistanPanamaPapua New GuineaParaguayPeruPhilippinesPolandPortugalPost-demographic dividendPre-demographic dividendQatarRomaniaRussian FederationRwandaSamoaSaudi ArabiaSenegalSerbiaSeychellesSierra LeoneSingaporeSlovak RepublicSloveniaSmall statesSomaliaSouth AfricaSouth AsiaSouth Asia (IDA & IBRD)SpainSri LankaSt. Kitts and NevisSt. LuciaSt. Vincent and the GrenadinesSub-Saharan Africa Sub-Saharan Africa (excluding high income)Sub-Saharan Africa (IDA & IBRD countries)SudanSurinameSwedenSwitzerlandSyrian Arab RepublicTajikistanTanzaniaThailandTogoTrinidad and TobagoTunisiaTurkeyTurkmenistanUgandaUkraineUnited Arab EmiratesUnited KingdomUnited StatesUpper middle incomeUruguayUzbekistanVenezuela, RBVietnamWorldYemen, Rep.ZambiaZimbabwe Timeline:
This timeline shows a graph from 1961 to 2015 of Austria. No data until 1960. Number of actual observations by date: 55.
Source name:
World Development Indicators
Source organization:
World Bank staff estimates based data from International Monetary Fund's Direction of Trade database.
Categories, topics:
Private Sector, Trade
Last updated:
apr 23, 2017
Indicators value changes by year
At the date of observation
Value
Absolute change
Change from previous value
jan 1, 1961
1.051
+1.051
0.0%
jan 1, 1962
0.873
-0.177
-16.86%
jan 1, 1963
0.628
-0.245
-28.09%
jan 1, 1964
0.654
+0.026
4.21%
jan 1, 1965
0.691
+0.037
5.64%
jan 1, 1966
0.63
-0.061
-8.84%
jan 1, 1967
0.653
+0.023
3.66%
jan 1, 1968
0.485
-0.168
-25.77%
jan 1, 1969
0.577
+0.092
18.9%
jan 1, 1970
0.669
+0.092
16.01%
jan 1, 1971
0.959
+0.29
43.42%
jan 1, 1972
1.97
+1.011
105.37%
jan 1, 1973
1.7
-0.27
-13.71%
jan 1, 1974
2.256
+0.556
32.69%
jan 1, 1975
5.96
+3.704
164.17%
jan 1, 1976
4.654
-1.306
-21.91%
jan 1, 1977
4.202
-0.452
-9.71%
jan 1, 1978
3.212
-0.99
-23.56%
jan 1, 1979
3.483
+0.271
8.43%
jan 1, 1980
4.355
+0.872
25.04%
jan 1, 1981
4.359
+0.004
0.1%
jan 1, 1982
3.554
-0.805
-18.47%
jan 1, 1983
3.072
-0.482
-13.56%
jan 1, 1984
2.423
-0.649
-21.12%
jan 1, 1985
3.041
+0.617
25.46%
jan 1, 1986
3.021
-0.019
-0.63%
jan 1, 1987
1.749
-1.272
-42.12%
jan 1, 1988
1.834
+0.085
4.85%
jan 1, 1989
1.384
-0.449
-24.51%
jan 1, 1990
1.785
+0.401
28.97%
jan 1, 1991
2.022
+0.237
13.26%
jan 1, 1992
1.661
-0.361
-17.84%
jan 1, 1993
1.298
-0.363
-21.87%
jan 1, 1994
1.087
-0.211
-16.23%
jan 1, 1995
1.222
+0.134
12.36%
jan 1, 1996
0.784
-0.438
-35.86%
jan 1, 1997
1.047
+0.263
33.62%
jan 1, 1998
1.222
+0.175
16.74%
jan 1, 1999
0.835
-0.387
-31.69%
jan 1, 2000
0.848
+0.013
1.6%
jan 1, 2001
1.031
+0.183
21.58%
jan 1, 2002
1.038
+0.007
0.65%
jan 1, 2003
0.789
-0.249
-24.02%
jan 1, 2004
0.625
-0.163
-20.71%
jan 1, 2005
0.522
-0.104
-16.61%
jan 1, 2006
0.446
-0.076
-14.5%
jan 1, 2007
1.028
+0.582
130.61%
jan 1, 2008
1.586
+0.558
54.24%
jan 1, 2009
1.866
+0.28
17.63%
jan 1, 2010
1.121
-0.745
-39.9%
jan 1, 2011
1.362
+0.241
21.5%
jan 1, 2012
0.915
-0.448
-32.87%
jan 1, 2013
0.902
-0.013
-1.37%
jan 1, 2014
0.838
-0.064
-7.11%
jan 1, 2015
0.95
+0.112
13.35%
Ranking of countries by current statistics by years


Comments: