29
/
en
AIzaSyAYiBZKx7MnpbEhh9jyipgxe19OcubqV5w
April 1, 2024
256602
Sweden
SWE
true
2
1
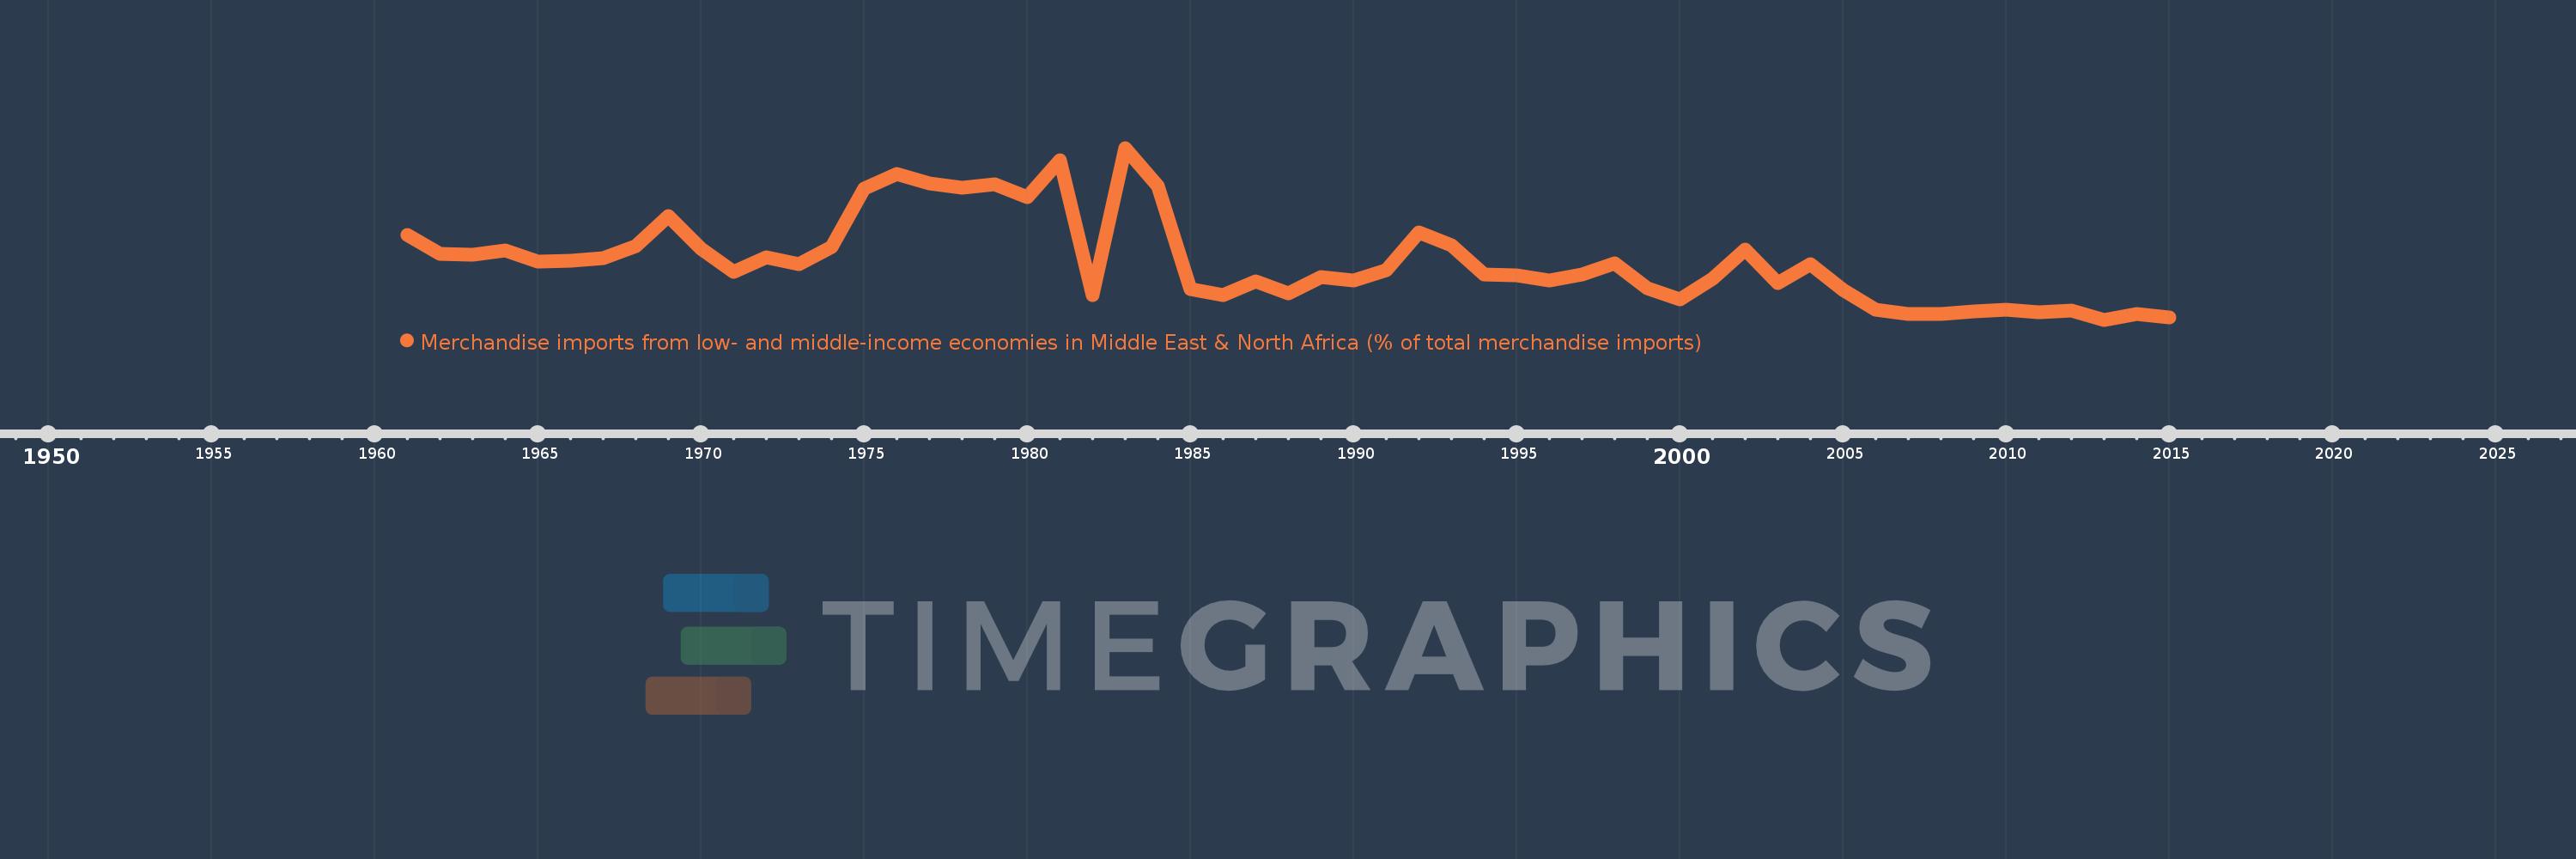
Merchandise imports from low- and middle-income economies in Middle East & North Africa (% of total merchandise imports)
2015,2014,2013,2012,2011,2010,2009,2008,2007,2006,2005,2004,2003,2002,2001,2000,1999,1998,1997,1996,1995,1994,1993,1992,1991,1990,1989,1988,1987,1986,1985,1984,1983,1982,1981,1980,1979,1978,1977,1976,1975,1974,1973,1972,1971,1970,1969,1968,1967,1966,1965,1964,1963,1962,1961
Global statistics library →Sweden →Merchandise imports from low- and middle-income economies in Middle East & North Africa (% of total merchandise imports)
This statistics in other country:
AfghanistanAlbaniaAlgeriaAngolaArab WorldArgentinaArmeniaArubaAustraliaAustriaAzerbaijanBahamas, TheBahrainBangladeshBarbadosBelarusBelgiumBelizeBeninBermudaBoliviaBosnia and HerzegovinaBrazilBrunei DarussalamBulgariaBurkina FasoBurundiCabo VerdeCambodiaCameroonCanadaCaribbean small statesCentral African RepublicCentral Europe and the BalticsChadChileChinaColombiaComorosCongo, Dem. Rep.Congo, Rep.Costa RicaCote d'IvoireCroatiaCubaCyprusCzech RepublicDenmarkDjiboutiDominicaDominican RepublicEarly-demographic dividendEast Asia & PacificEast Asia & Pacific (excluding high income)East Asia & Pacific (IDA & IBRD countries)EcuadorEgypt, Arab Rep.El SalvadorEstoniaEthiopiaEuro areaEurope & Central AsiaEurope & Central Asia (excluding high income)Europe & Central Asia (IDA & IBRD countries)European UnionFijiFinlandFragile and conflict affected situationsFranceFrench PolynesiaGabonGambia, TheGeorgiaGermanyGhanaGreeceGreenlandGrenadaGuatemalaGuineaGuinea-BissauGuyanaHaitiHeavily indebted poor countries (HIPC)High incomeHondurasHong Kong SAR, ChinaHungaryIBRD onlyIcelandIDA & IBRD totalIDA blendIDA onlyIDA totalIndiaIndonesiaIran, Islamic Rep.IraqIrelandIsraelItalyJamaicaJapanJordanKazakhstanKenyaKorea, Dem. People’s Rep.Korea, Rep.KosovoKuwaitKyrgyz RepublicLao PDRLate-demographic dividendLatin America & Caribbean Latin America & Caribbean (excluding high income)Latin America & the Caribbean (IDA & IBRD countries)LatviaLeast developed countries: UN classificationLebanonLiberiaLibyaLithuaniaLow & middle incomeLow incomeLower middle incomeLuxembourgMacao SAR, ChinaMacedonia, FYRMadagascarMalawiMalaysiaMaldivesMaliMaltaMauritaniaMauritiusMexicoMiddle East & North AfricaMiddle East & North Africa (excluding high income)Middle East & North Africa (IDA & IBRD countries)Middle incomeMoldovaMongoliaMontenegroMoroccoMozambiqueMyanmarNepalNetherlandsNew CaledoniaNew ZealandNicaraguaNigerNigeriaNorth AmericaNorwayOECD membersOmanOther small statesPacific island small statesPakistanPanamaPapua New GuineaParaguayPeruPhilippinesPolandPortugalPost-demographic dividendPre-demographic dividendQatarRomaniaRussian FederationRwandaSamoaSaudi ArabiaSenegalSerbiaSeychellesSierra LeoneSingaporeSlovak RepublicSloveniaSmall statesSomaliaSouth AfricaSouth AsiaSouth Asia (IDA & IBRD)SpainSri LankaSt. Kitts and NevisSt. LuciaSt. Vincent and the GrenadinesSub-Saharan Africa Sub-Saharan Africa (excluding high income)Sub-Saharan Africa (IDA & IBRD countries)SudanSurinameSwedenSwitzerlandSyrian Arab RepublicTajikistanTanzaniaThailandTogoTrinidad and TobagoTunisiaTurkeyTurkmenistanUgandaUkraineUnited Arab EmiratesUnited KingdomUnited StatesUpper middle incomeUruguayUzbekistanVenezuela, RBVietnamWorldYemen, Rep.ZambiaZimbabwe Timeline:
This timeline shows a graph from 1961 to 2015 of Sweden. No data until 1960. Number of actual observations by date: 55.
Source name:
World Development Indicators
Source organization:
World Bank staff estimates based data from International Monetary Fund's Direction of Trade database.
Categories, topics:
Private Sector, Trade
Last updated:
apr 23, 2017
Indicators value changes by year
At the date of observation
Value
Absolute change
Change from previous value
jan 1, 1961
1.22
+1.22
0.0%
jan 1, 1962
0.985
-0.236
-19.32%
jan 1, 1963
0.969
-0.015
-1.54%
jan 1, 1964
1.02
+0.051
5.24%
jan 1, 1965
0.878
-0.142
-13.94%
jan 1, 1966
0.889
+0.011
1.3%
jan 1, 1967
0.928
+0.039
4.36%
jan 1, 1968
1.077
+0.149
16.05%
jan 1, 1969
1.458
+0.381
35.35%
jan 1, 1970
1.042
-0.416
-28.53%
jan 1, 1971
0.751
-0.291
-27.93%
jan 1, 1972
0.941
+0.19
25.35%
jan 1, 1973
0.85
-0.091
-9.72%
jan 1, 1974
1.074
+0.224
26.38%
jan 1, 1975
1.808
+0.735
68.41%
jan 1, 1976
2.003
+0.195
10.77%
jan 1, 1977
1.877
-0.126
-6.3%
jan 1, 1978
1.818
-0.06
-3.17%
jan 1, 1979
1.872
+0.054
2.97%
jan 1, 1980
1.698
-0.173
-9.26%
jan 1, 1981
2.168
+0.47
27.68%
jan 1, 1982
0.452
-1.716
-79.16%
jan 1, 1983
2.329
+1.878
415.52%
jan 1, 1984
1.84
-0.49
-21.02%
jan 1, 1985
0.53
-1.31
-71.22%
jan 1, 1986
0.459
-0.07
-13.26%
jan 1, 1987
0.63
+0.171
37.23%
jan 1, 1988
0.481
-0.149
-23.7%
jan 1, 1989
0.691
+0.211
43.77%
jan 1, 1990
0.638
-0.054
-7.74%
jan 1, 1991
0.77
+0.133
20.78%
jan 1, 1992
1.257
+0.487
63.15%
jan 1, 1993
1.096
-0.161
-12.79%
jan 1, 1994
0.718
-0.378
-34.51%
jan 1, 1995
0.707
-0.011
-1.58%
jan 1, 1996
0.646
-0.061
-8.63%
jan 1, 1997
0.719
+0.073
11.32%
jan 1, 1998
0.866
+0.148
20.57%
jan 1, 1999
0.549
-0.318
-36.69%
jan 1, 2000
0.406
-0.143
-26.0%
jan 1, 2001
0.668
+0.262
64.65%
jan 1, 2002
1.032
+0.363
54.35%
jan 1, 2003
0.61
-0.422
-40.89%
jan 1, 2004
0.853
+0.243
39.89%
jan 1, 2005
0.521
-0.332
-38.93%
jan 1, 2006
0.271
-0.25
-48.03%
jan 1, 2007
0.214
-0.057
-21.01%
jan 1, 2008
0.218
+0.005
2.15%
jan 1, 2009
0.246
+0.027
12.48%
jan 1, 2010
0.271
+0.025
10.18%
jan 1, 2011
0.24
-0.03
-11.26%
jan 1, 2012
0.255
+0.015
6.21%
jan 1, 2013
0.143
-0.112
-43.76%
jan 1, 2014
0.218
+0.075
52.25%
jan 1, 2015
0.171
-0.048
-21.84%
Ranking of countries by current statistics by years


Comments: