29
/
en
AIzaSyAYiBZKx7MnpbEhh9jyipgxe19OcubqV5w
April 1, 2024
135798
Gabon
GAB
true
2
1
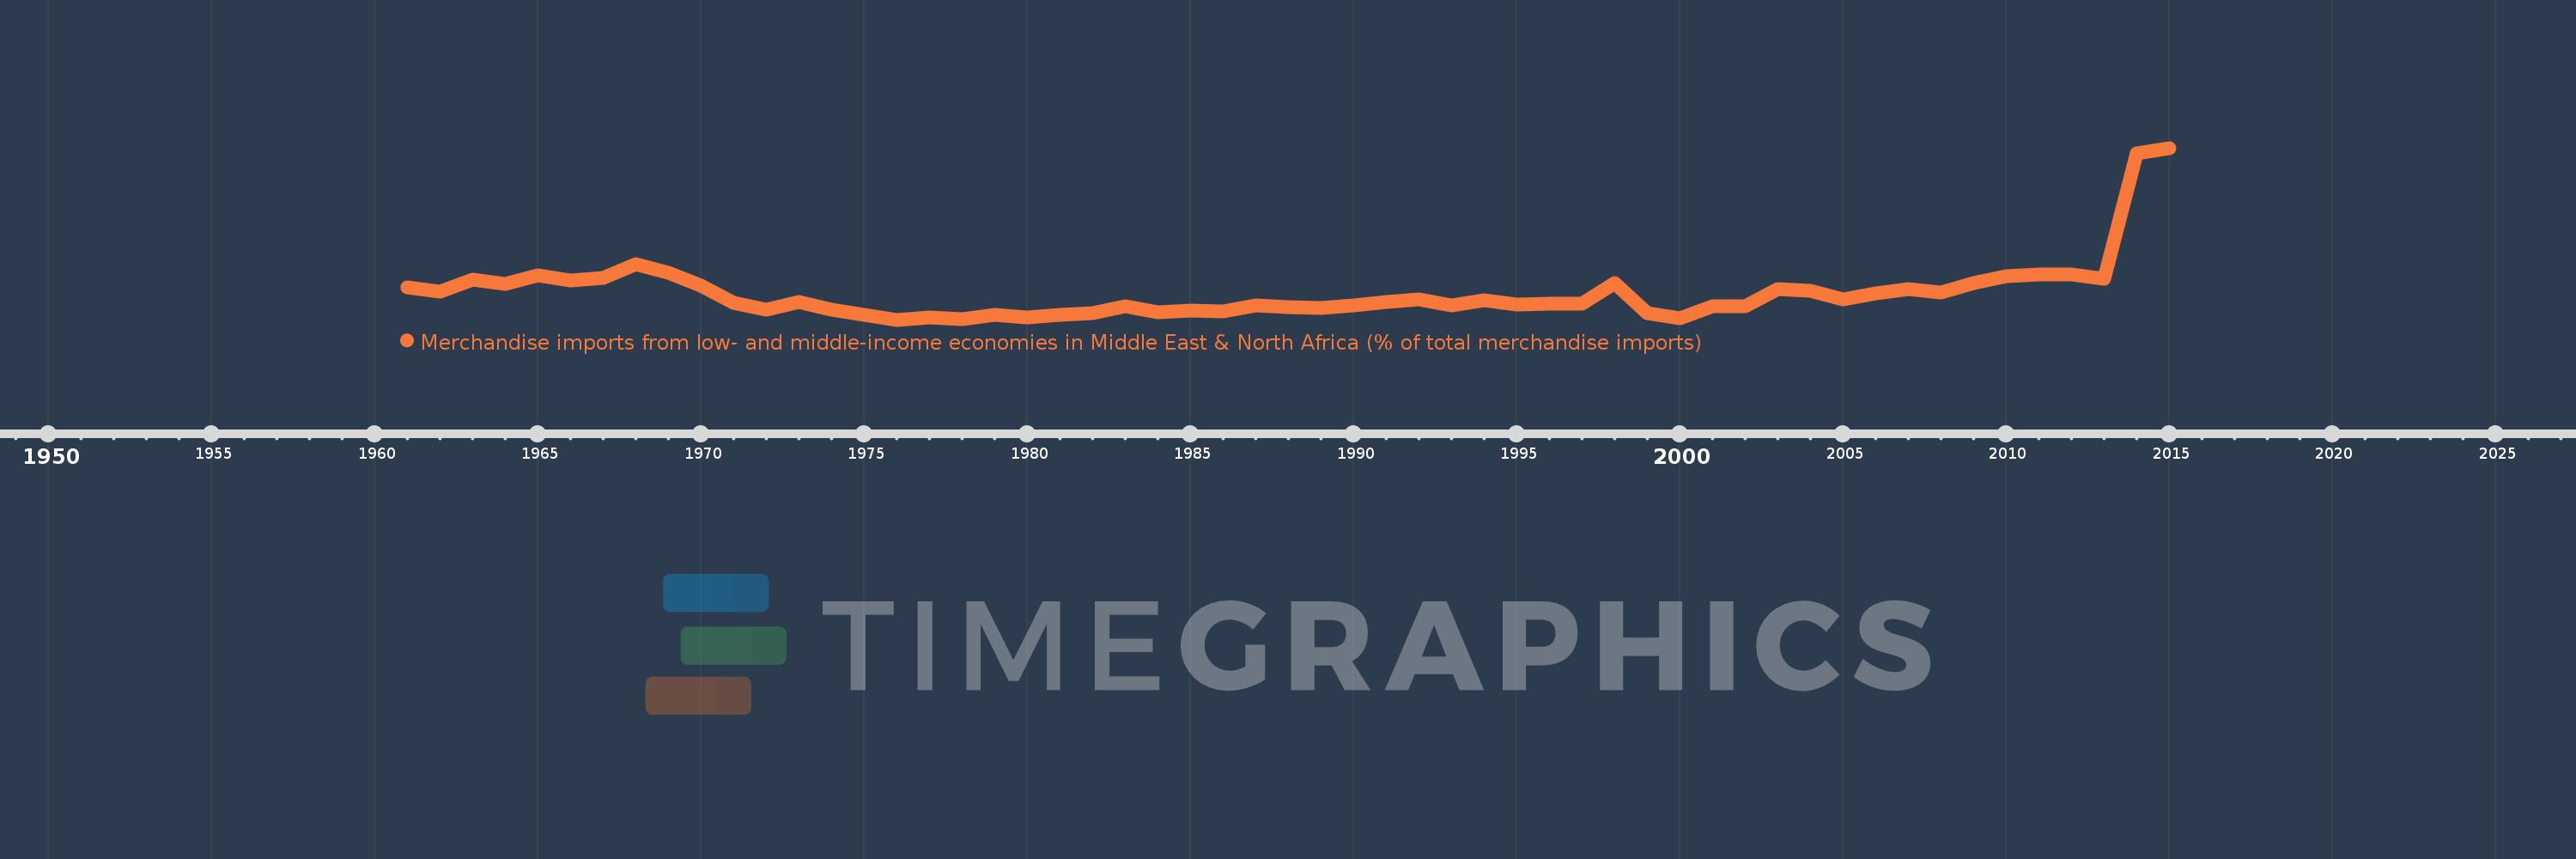
Merchandise imports from low- and middle-income economies in Middle East & North Africa (% of total merchandise imports)
2015,2014,2013,2012,2011,2010,2009,2008,2007,2006,2005,2004,2003,2002,2001,2000,1999,1998,1997,1996,1995,1994,1993,1992,1991,1990,1989,1988,1987,1986,1985,1984,1983,1982,1981,1980,1979,1978,1977,1976,1975,1974,1973,1972,1971,1970,1969,1968,1967,1966,1965,1964,1963,1962,1961
Global statistics library →Gabon →Merchandise imports from low- and middle-income economies in Middle East & North Africa (% of total merchandise imports)
This statistics in other country:
AfghanistanAlbaniaAlgeriaAngolaArab WorldArgentinaArmeniaArubaAustraliaAustriaAzerbaijanBahamas, TheBahrainBangladeshBarbadosBelarusBelgiumBelizeBeninBermudaBoliviaBosnia and HerzegovinaBrazilBrunei DarussalamBulgariaBurkina FasoBurundiCabo VerdeCambodiaCameroonCanadaCaribbean small statesCentral African RepublicCentral Europe and the BalticsChadChileChinaColombiaComorosCongo, Dem. Rep.Congo, Rep.Costa RicaCote d'IvoireCroatiaCubaCyprusCzech RepublicDenmarkDjiboutiDominicaDominican RepublicEarly-demographic dividendEast Asia & PacificEast Asia & Pacific (excluding high income)East Asia & Pacific (IDA & IBRD countries)EcuadorEgypt, Arab Rep.El SalvadorEstoniaEthiopiaEuro areaEurope & Central AsiaEurope & Central Asia (excluding high income)Europe & Central Asia (IDA & IBRD countries)European UnionFijiFinlandFragile and conflict affected situationsFranceFrench PolynesiaGabonGambia, TheGeorgiaGermanyGhanaGreeceGreenlandGrenadaGuatemalaGuineaGuinea-BissauGuyanaHaitiHeavily indebted poor countries (HIPC)High incomeHondurasHong Kong SAR, ChinaHungaryIBRD onlyIcelandIDA & IBRD totalIDA blendIDA onlyIDA totalIndiaIndonesiaIran, Islamic Rep.IraqIrelandIsraelItalyJamaicaJapanJordanKazakhstanKenyaKorea, Dem. People’s Rep.Korea, Rep.KosovoKuwaitKyrgyz RepublicLao PDRLate-demographic dividendLatin America & Caribbean Latin America & Caribbean (excluding high income)Latin America & the Caribbean (IDA & IBRD countries)LatviaLeast developed countries: UN classificationLebanonLiberiaLibyaLithuaniaLow & middle incomeLow incomeLower middle incomeLuxembourgMacao SAR, ChinaMacedonia, FYRMadagascarMalawiMalaysiaMaldivesMaliMaltaMauritaniaMauritiusMexicoMiddle East & North AfricaMiddle East & North Africa (excluding high income)Middle East & North Africa (IDA & IBRD countries)Middle incomeMoldovaMongoliaMontenegroMoroccoMozambiqueMyanmarNepalNetherlandsNew CaledoniaNew ZealandNicaraguaNigerNigeriaNorth AmericaNorwayOECD membersOmanOther small statesPacific island small statesPakistanPanamaPapua New GuineaParaguayPeruPhilippinesPolandPortugalPost-demographic dividendPre-demographic dividendQatarRomaniaRussian FederationRwandaSamoaSaudi ArabiaSenegalSerbiaSeychellesSierra LeoneSingaporeSlovak RepublicSloveniaSmall statesSomaliaSouth AfricaSouth AsiaSouth Asia (IDA & IBRD)SpainSri LankaSt. Kitts and NevisSt. LuciaSt. Vincent and the GrenadinesSub-Saharan Africa Sub-Saharan Africa (excluding high income)Sub-Saharan Africa (IDA & IBRD countries)SudanSurinameSwedenSwitzerlandSyrian Arab RepublicTajikistanTanzaniaThailandTogoTrinidad and TobagoTunisiaTurkeyTurkmenistanUgandaUkraineUnited Arab EmiratesUnited KingdomUnited StatesUpper middle incomeUruguayUzbekistanVenezuela, RBVietnamWorldYemen, Rep.ZambiaZimbabwe Timeline:
This timeline shows a graph from 1961 to 2015 of Gabon. No data until 1960. Number of actual observations by date: 55.
Source name:
World Development Indicators
Source organization:
World Bank staff estimates based data from International Monetary Fund's Direction of Trade database.
Categories, topics:
Private Sector, Trade
Last updated:
apr 23, 2017
Indicators value changes by year
At the date of observation
Value
Absolute change
Change from previous value
jan 1, 1961
1.887
+1.887
0.0%
jan 1, 1962
1.676
-0.211
-11.17%
jan 1, 1963
2.32
+0.644
38.4%
jan 1, 1964
2.079
-0.241
-10.37%
jan 1, 1965
2.523
+0.444
21.33%
jan 1, 1966
2.247
-0.275
-10.91%
jan 1, 1967
2.41
+0.162
7.23%
jan 1, 1968
3.111
+0.701
29.11%
jan 1, 1969
2.665
-0.447
-14.35%
jan 1, 1970
1.965
-0.7
-26.27%
jan 1, 1971
1.072
-0.892
-45.42%
jan 1, 1972
0.687
-0.385
-35.9%
jan 1, 1973
1.115
+0.428
62.22%
jan 1, 1974
0.688
-0.427
-38.29%
jan 1, 1975
0.41
-0.278
-40.41%
jan 1, 1976
0.169
-0.241
-58.89%
jan 1, 1977
0.305
+0.137
81.09%
jan 1, 1978
0.215
-0.09
-29.41%
jan 1, 1979
0.45
+0.234
108.78%
jan 1, 1980
0.286
-0.164
-36.41%
jan 1, 1981
0.431
+0.144
50.48%
jan 1, 1982
0.528
+0.097
22.58%
jan 1, 1983
0.875
+0.347
65.83%
jan 1, 1984
0.562
-0.313
-35.81%
jan 1, 1985
0.664
+0.102
18.22%
jan 1, 1986
0.63
-0.034
-5.1%
jan 1, 1987
0.922
+0.292
46.32%
jan 1, 1988
0.858
-0.064
-6.92%
jan 1, 1989
0.811
-0.047
-5.49%
jan 1, 1990
0.932
+0.121
14.91%
jan 1, 1991
1.101
+0.169
18.12%
jan 1, 1992
1.274
+0.173
15.68%
jan 1, 1993
0.921
-0.352
-27.66%
jan 1, 1994
1.225
+0.304
32.95%
jan 1, 1995
0.976
-0.249
-20.36%
jan 1, 1996
1.033
+0.058
5.91%
jan 1, 1997
1.04
+0.007
0.66%
jan 1, 1998
2.135
+1.095
105.3%
jan 1, 1999
0.507
-1.628
-76.24%
jan 1, 2000
0.254
-0.254
-49.99%
jan 1, 2001
0.908
+0.655
258.04%
jan 1, 2002
0.9
-0.009
-0.95%
jan 1, 2003
1.787
+0.887
98.59%
jan 1, 2004
1.712
-0.075
-4.22%
jan 1, 2005
1.24
-0.472
-27.58%
jan 1, 2006
1.586
+0.346
27.91%
jan 1, 2007
1.795
+0.209
13.18%
jan 1, 2008
1.629
-0.166
-9.22%
jan 1, 2009
2.102
+0.473
29.01%
jan 1, 2010
2.468
+0.366
17.42%
jan 1, 2011
2.596
+0.128
5.19%
jan 1, 2012
2.564
-0.032
-1.25%
jan 1, 2013
2.362
-0.202
-7.88%
jan 1, 2014
9.024
+6.662
282.12%
jan 1, 2015
9.323
+0.3
3.32%
Ranking of countries by current statistics by years


Comments: