29
/
en
AIzaSyAYiBZKx7MnpbEhh9jyipgxe19OcubqV5w
April 1, 2024
171957
Kuwait
KWT
true
2
1
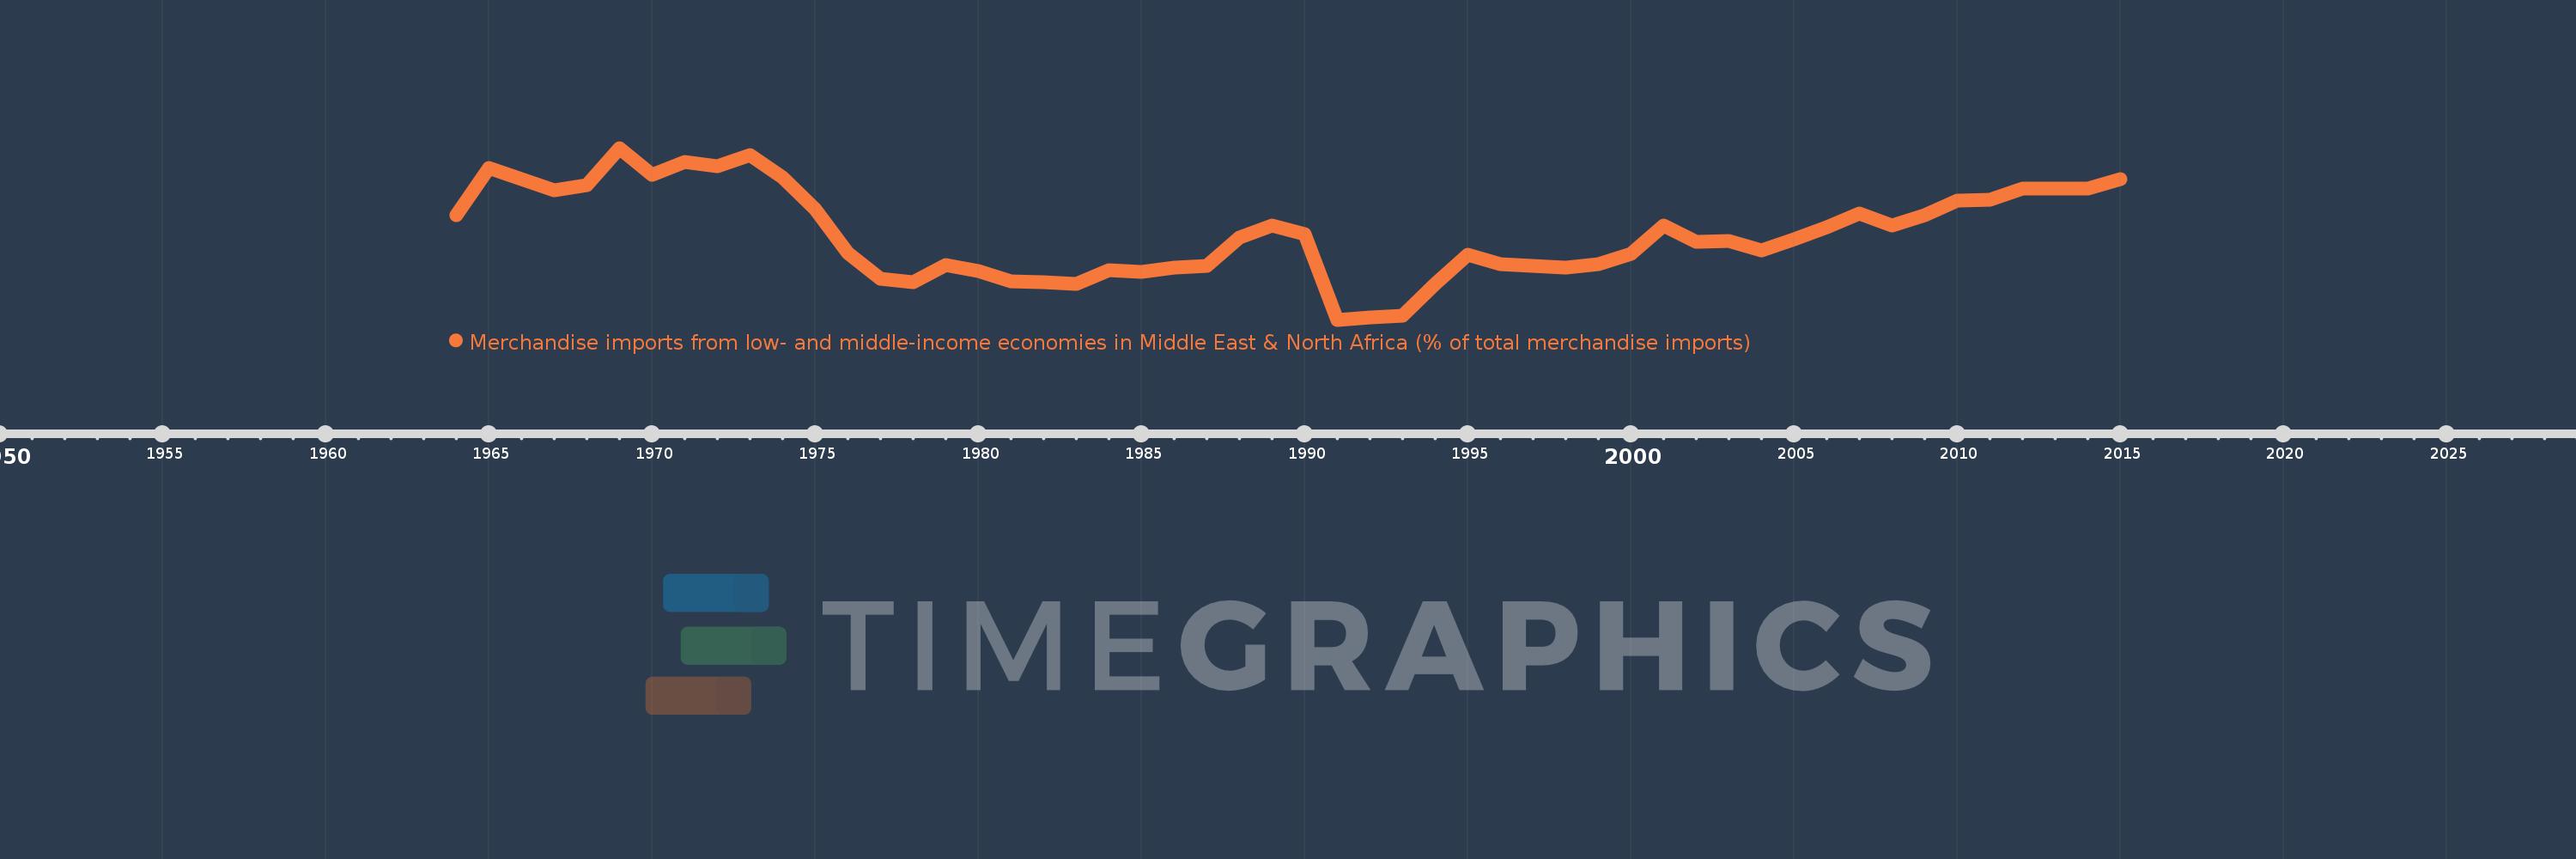
Merchandise imports from low- and middle-income economies in Middle East & North Africa (% of total merchandise imports)
2015,2014,2013,2012,2011,2010,2009,2008,2007,2006,2005,2004,2003,2002,2001,2000,1999,1998,1997,1996,1995,1994,1993,1992,1991,1990,1989,1988,1987,1986,1985,1984,1983,1982,1981,1980,1979,1978,1977,1976,1975,1974,1973,1972,1971,1970,1969,1968,1967,1965,1964
Global statistics library →Kuwait →Merchandise imports from low- and middle-income economies in Middle East & North Africa (% of total merchandise imports)
This statistics in other country:
AfghanistanAlbaniaAlgeriaAngolaArab WorldArgentinaArmeniaArubaAustraliaAustriaAzerbaijanBahamas, TheBahrainBangladeshBarbadosBelarusBelgiumBelizeBeninBermudaBoliviaBosnia and HerzegovinaBrazilBrunei DarussalamBulgariaBurkina FasoBurundiCabo VerdeCambodiaCameroonCanadaCaribbean small statesCentral African RepublicCentral Europe and the BalticsChadChileChinaColombiaComorosCongo, Dem. Rep.Congo, Rep.Costa RicaCote d'IvoireCroatiaCubaCyprusCzech RepublicDenmarkDjiboutiDominicaDominican RepublicEarly-demographic dividendEast Asia & PacificEast Asia & Pacific (excluding high income)East Asia & Pacific (IDA & IBRD countries)EcuadorEgypt, Arab Rep.El SalvadorEstoniaEthiopiaEuro areaEurope & Central AsiaEurope & Central Asia (excluding high income)Europe & Central Asia (IDA & IBRD countries)European UnionFijiFinlandFragile and conflict affected situationsFranceFrench PolynesiaGabonGambia, TheGeorgiaGermanyGhanaGreeceGreenlandGrenadaGuatemalaGuineaGuinea-BissauGuyanaHaitiHeavily indebted poor countries (HIPC)High incomeHondurasHong Kong SAR, ChinaHungaryIBRD onlyIcelandIDA & IBRD totalIDA blendIDA onlyIDA totalIndiaIndonesiaIran, Islamic Rep.IraqIrelandIsraelItalyJamaicaJapanJordanKazakhstanKenyaKorea, Dem. People’s Rep.Korea, Rep.KosovoKuwaitKyrgyz RepublicLao PDRLate-demographic dividendLatin America & Caribbean Latin America & Caribbean (excluding high income)Latin America & the Caribbean (IDA & IBRD countries)LatviaLeast developed countries: UN classificationLebanonLiberiaLibyaLithuaniaLow & middle incomeLow incomeLower middle incomeLuxembourgMacao SAR, ChinaMacedonia, FYRMadagascarMalawiMalaysiaMaldivesMaliMaltaMauritaniaMauritiusMexicoMiddle East & North AfricaMiddle East & North Africa (excluding high income)Middle East & North Africa (IDA & IBRD countries)Middle incomeMoldovaMongoliaMontenegroMoroccoMozambiqueMyanmarNepalNetherlandsNew CaledoniaNew ZealandNicaraguaNigerNigeriaNorth AmericaNorwayOECD membersOmanOther small statesPacific island small statesPakistanPanamaPapua New GuineaParaguayPeruPhilippinesPolandPortugalPost-demographic dividendPre-demographic dividendQatarRomaniaRussian FederationRwandaSamoaSaudi ArabiaSenegalSerbiaSeychellesSierra LeoneSingaporeSlovak RepublicSloveniaSmall statesSomaliaSouth AfricaSouth AsiaSouth Asia (IDA & IBRD)SpainSri LankaSt. Kitts and NevisSt. LuciaSt. Vincent and the GrenadinesSub-Saharan Africa Sub-Saharan Africa (excluding high income)Sub-Saharan Africa (IDA & IBRD countries)SudanSurinameSwedenSwitzerlandSyrian Arab RepublicTajikistanTanzaniaThailandTogoTrinidad and TobagoTunisiaTurkeyTurkmenistanUgandaUkraineUnited Arab EmiratesUnited KingdomUnited StatesUpper middle incomeUruguayUzbekistanVenezuela, RBVietnamWorldYemen, Rep.ZambiaZimbabwe Timeline:
This timeline shows a graph from 1964 to 2015 of Kuwait. No data until 1963. Number of actual observations by date: 51.
Source name:
World Development Indicators
Source organization:
World Bank staff estimates based data from International Monetary Fund's Direction of Trade database.
Categories, topics:
Private Sector, Trade
Last updated:
apr 23, 2017
Indicators value changes by year
Maximum:
10.498
jan 1, 1969
At the date of observation
Value
Absolute change
Change from previous value
jan 1, 1964
6.516
+6.516
0.0%
jan 1, 1965
9.302
+2.786
42.75%
jan 1, 1967
7.994
-1.308
-14.07%
jan 1, 1968
8.272
+0.278
3.47%
jan 1, 1969
10.498
+2.226
26.92%
jan 1, 1970
8.881
-1.617
-15.4%
jan 1, 1971
9.664
+0.783
8.81%
jan 1, 1972
9.41
-0.254
-2.63%
jan 1, 1973
10.095
+0.686
7.29%
jan 1, 1974
8.758
-1.338
-13.25%
jan 1, 1975
6.883
-1.874
-21.4%
jan 1, 1976
4.297
-2.587
-37.58%
jan 1, 1977
2.747
-1.55
-36.08%
jan 1, 1978
2.528
-0.219
-7.97%
jan 1, 1979
3.569
+1.041
41.19%
jan 1, 1980
3.23
-0.339
-9.5%
jan 1, 1981
2.616
-0.614
-19.01%
jan 1, 1982
2.549
-0.067
-2.55%
jan 1, 1983
2.42
-0.129
-5.06%
jan 1, 1984
3.26
+0.84
34.72%
jan 1, 1985
3.164
-0.096
-2.95%
jan 1, 1986
3.415
+0.251
7.93%
jan 1, 1987
3.525
+0.11
3.21%
jan 1, 1988
5.185
+1.661
47.11%
jan 1, 1989
5.878
+0.692
13.35%
jan 1, 1990
5.392
-0.486
-8.26%
jan 1, 1991
0.321
-5.071
-94.05%
jan 1, 1992
0.464
+0.143
44.55%
jan 1, 1993
0.558
+0.094
20.21%
jan 1, 1994
2.455
+1.897
339.96%
jan 1, 1995
4.19
+1.735
70.69%
jan 1, 1996
3.593
-0.597
-14.24%
jan 1, 1997
3.503
-0.09
-2.51%
jan 1, 1998
3.401
-0.102
-2.91%
jan 1, 1999
3.625
+0.224
6.59%
jan 1, 2000
4.241
+0.615
16.98%
jan 1, 2001
5.909
+1.668
39.34%
jan 1, 2002
4.921
-0.988
-16.72%
jan 1, 2003
5.003
+0.082
1.67%
jan 1, 2004
4.407
-0.596
-11.92%
jan 1, 2005
5.1
+0.693
15.73%
jan 1, 2006
5.795
+0.694
13.62%
jan 1, 2007
6.599
+0.804
13.87%
jan 1, 2008
5.919
-0.68
-10.3%
jan 1, 2009
6.522
+0.603
10.19%
jan 1, 2010
7.389
+0.867
13.29%
jan 1, 2011
7.451
+0.062
0.84%
jan 1, 2012
8.076
+0.626
8.4%
jan 1, 2013
8.113
+0.037
0.46%
jan 1, 2014
8.116
+0.002
0.03%
jan 1, 2015
8.659
+0.544
6.7%
Ranking of countries by current statistics by years


Comments: