29
/
en
AIzaSyAYiBZKx7MnpbEhh9jyipgxe19OcubqV5w
April 1, 2024
63743
Afghanistan
AFG
true
2
1
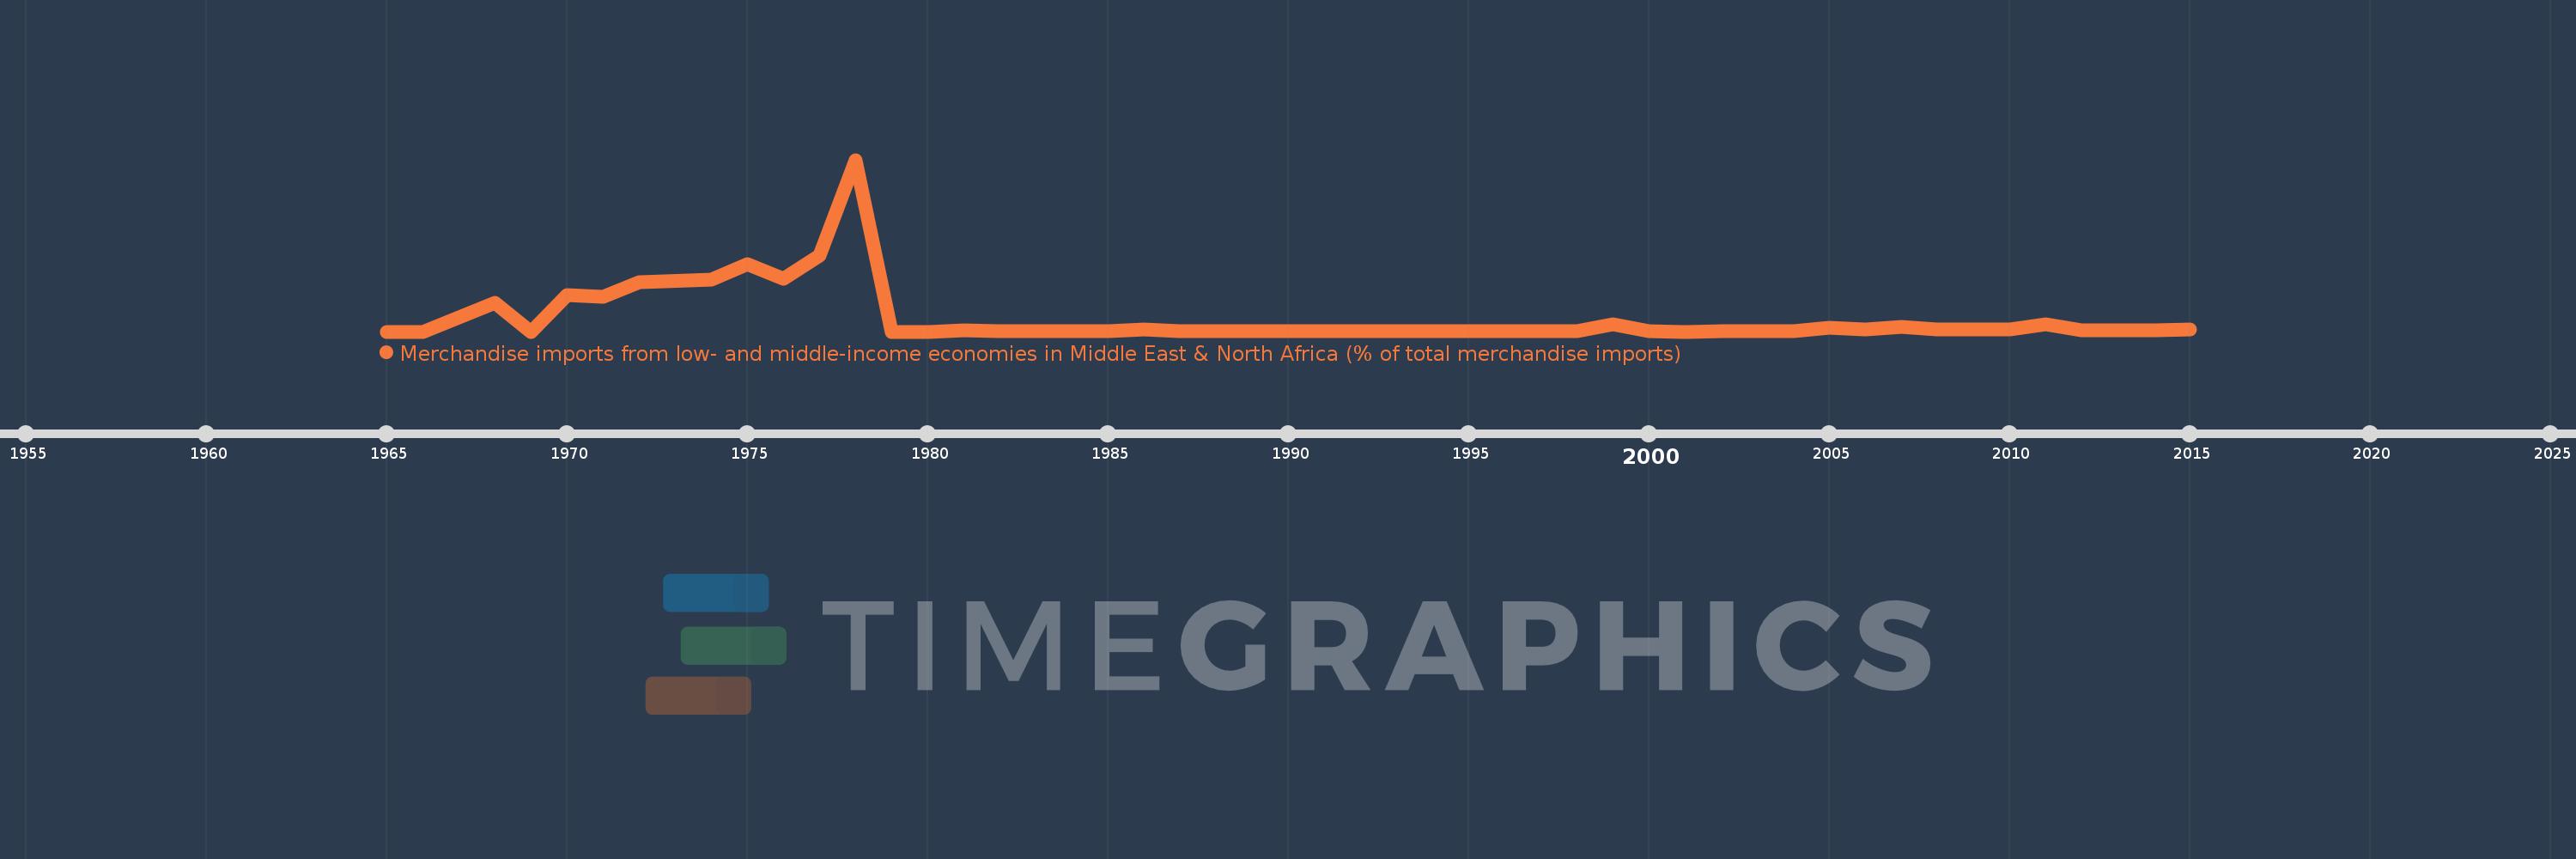
Merchandise imports from low- and middle-income economies in Middle East & North Africa (% of total merchandise imports)
2015,2014,2013,2012,2011,2010,2009,2008,2007,2006,2005,2004,2003,2002,2001,2000,1999,1998,1997,1996,1995,1994,1993,1992,1991,1990,1989,1988,1987,1986,1985,1984,1983,1982,1981,1980,1979,1978,1977,1976,1975,1974,1972,1971,1970,1969,1968,1966,1965
This statistics in other country:
AfghanistanAlbaniaAlgeriaAngolaArab WorldArgentinaArmeniaArubaAustraliaAustriaAzerbaijanBahamas, TheBahrainBangladeshBarbadosBelarusBelgiumBelizeBeninBermudaBoliviaBosnia and HerzegovinaBrazilBrunei DarussalamBulgariaBurkina FasoBurundiCabo VerdeCambodiaCameroonCanadaCaribbean small statesCentral African RepublicCentral Europe and the BalticsChadChileChinaColombiaComorosCongo, Dem. Rep.Congo, Rep.Costa RicaCote d'IvoireCroatiaCubaCyprusCzech RepublicDenmarkDjiboutiDominicaDominican RepublicEarly-demographic dividendEast Asia & PacificEast Asia & Pacific (excluding high income)East Asia & Pacific (IDA & IBRD countries)EcuadorEgypt, Arab Rep.El SalvadorEstoniaEthiopiaEuro areaEurope & Central AsiaEurope & Central Asia (excluding high income)Europe & Central Asia (IDA & IBRD countries)European UnionFijiFinlandFragile and conflict affected situationsFranceFrench PolynesiaGabonGambia, TheGeorgiaGermanyGhanaGreeceGreenlandGrenadaGuatemalaGuineaGuinea-BissauGuyanaHaitiHeavily indebted poor countries (HIPC)High incomeHondurasHong Kong SAR, ChinaHungaryIBRD onlyIcelandIDA & IBRD totalIDA blendIDA onlyIDA totalIndiaIndonesiaIran, Islamic Rep.IraqIrelandIsraelItalyJamaicaJapanJordanKazakhstanKenyaKorea, Dem. People’s Rep.Korea, Rep.KosovoKuwaitKyrgyz RepublicLao PDRLate-demographic dividendLatin America & Caribbean Latin America & Caribbean (excluding high income)Latin America & the Caribbean (IDA & IBRD countries)LatviaLeast developed countries: UN classificationLebanonLiberiaLibyaLithuaniaLow & middle incomeLow incomeLower middle incomeLuxembourgMacao SAR, ChinaMacedonia, FYRMadagascarMalawiMalaysiaMaldivesMaliMaltaMauritaniaMauritiusMexicoMiddle East & North AfricaMiddle East & North Africa (excluding high income)Middle East & North Africa (IDA & IBRD countries)Middle incomeMoldovaMongoliaMontenegroMoroccoMozambiqueMyanmarNepalNetherlandsNew CaledoniaNew ZealandNicaraguaNigerNigeriaNorth AmericaNorwayOECD membersOmanOther small statesPacific island small statesPakistanPanamaPapua New GuineaParaguayPeruPhilippinesPolandPortugalPost-demographic dividendPre-demographic dividendQatarRomaniaRussian FederationRwandaSamoaSaudi ArabiaSenegalSerbiaSeychellesSierra LeoneSingaporeSlovak RepublicSloveniaSmall statesSomaliaSouth AfricaSouth AsiaSouth Asia (IDA & IBRD)SpainSri LankaSt. Kitts and NevisSt. LuciaSt. Vincent and the GrenadinesSub-Saharan Africa Sub-Saharan Africa (excluding high income)Sub-Saharan Africa (IDA & IBRD countries)SudanSurinameSwedenSwitzerlandSyrian Arab RepublicTajikistanTanzaniaThailandTogoTrinidad and TobagoTunisiaTurkeyTurkmenistanUgandaUkraineUnited Arab EmiratesUnited KingdomUnited StatesUpper middle incomeUruguayUzbekistanVenezuela, RBVietnamWorldYemen, Rep.ZambiaZimbabwe Timeline:
This timeline shows a graph from 1965 to 2015 of Afghanistan. No data until 1964. Number of actual observations by date: 49.
Source name:
World Development Indicators
Source organization:
World Bank staff estimates based data from International Monetary Fund's Direction of Trade database.
Categories, topics:
Private Sector, Trade
Last updated:
apr 23, 2017
Indicators value changes by year
Maximum:
14.567
jan 1, 1978
At the date of observation
Value
Absolute change
Change from previous value
jan 1, 1968
2.462
+2.462
%
jan 1, 1969
0.0
-2.462
-100.0%
jan 1, 1970
3.065
+3.065
%
jan 1, 1971
2.986
-0.079
-2.59%
jan 1, 1972
4.221
+1.236
41.38%
jan 1, 1974
4.4
+0.179
4.24%
jan 1, 1975
5.705
+1.305
29.65%
jan 1, 1976
4.487
-1.218
-21.35%
jan 1, 1977
6.451
+1.964
43.77%
jan 1, 1978
14.567
+8.117
125.83%
jan 1, 1979
0.0
-14.567
-100.0%
jan 1, 1981
0.097
+0.097
%
jan 1, 1982
0.009
-0.089
-91.09%
jan 1, 1983
0.012
+0.004
42.96%
jan 1, 1984
0.009
-0.003
-26.54%
jan 1, 1985
0.014
+0.005
51.81%
jan 1, 1986
0.149
+0.135
974.11%
jan 1, 1987
0.039
-0.11
-74.03%
jan 1, 1988
0.004
-0.035
-90.87%
jan 1, 1989
0.007
+0.004
102.46%
jan 1, 1990
0.008
+0.001
10.15%
jan 1, 1991
0.001
-0.007
-90.25%
jan 1, 1992
0.016
+0.015
1.95K%
jan 1, 1993
0.017
+0.001
5.72%
jan 1, 1994
0.009
-0.007
-44.03%
jan 1, 1995
0.023
+0.014
145.78%
jan 1, 1996
0.027
+0.005
20.37%
jan 1, 1997
0.001
-0.026
-96.32%
jan 1, 1998
0.026
+0.025
2.51K%
jan 1, 1999
0.608
+0.581
2.2K%
jan 1, 2000
0.005
-0.603
-99.24%
jan 1, 2001
0.0
-0.005
-100.0%
jan 1, 2002
0.035
+0.035
%
jan 1, 2003
0.028
-0.007
-20.81%
jan 1, 2004
0.033
+0.005
19.22%
jan 1, 2005
0.34
+0.308
934.0%
jan 1, 2006
0.191
-0.15
-43.98%
jan 1, 2007
0.416
+0.225
118.17%
jan 1, 2008
0.199
-0.217
-52.15%
jan 1, 2009
0.176
-0.023
-11.54%
jan 1, 2010
0.173
-0.004
-2.05%
jan 1, 2011
0.646
+0.473
274.14%
jan 1, 2012
0.11
-0.535
-82.9%
jan 1, 2013
0.077
-0.034
-30.5%
jan 1, 2014
0.087
+0.01
13.08%
jan 1, 2015
0.2
+0.113
130.08%
Ranking of countries by current statistics by years


Comments: