29
/
en
AIzaSyAYiBZKx7MnpbEhh9jyipgxe19OcubqV5w
April 1, 2024
190517
Mali
MLI
true
2
1
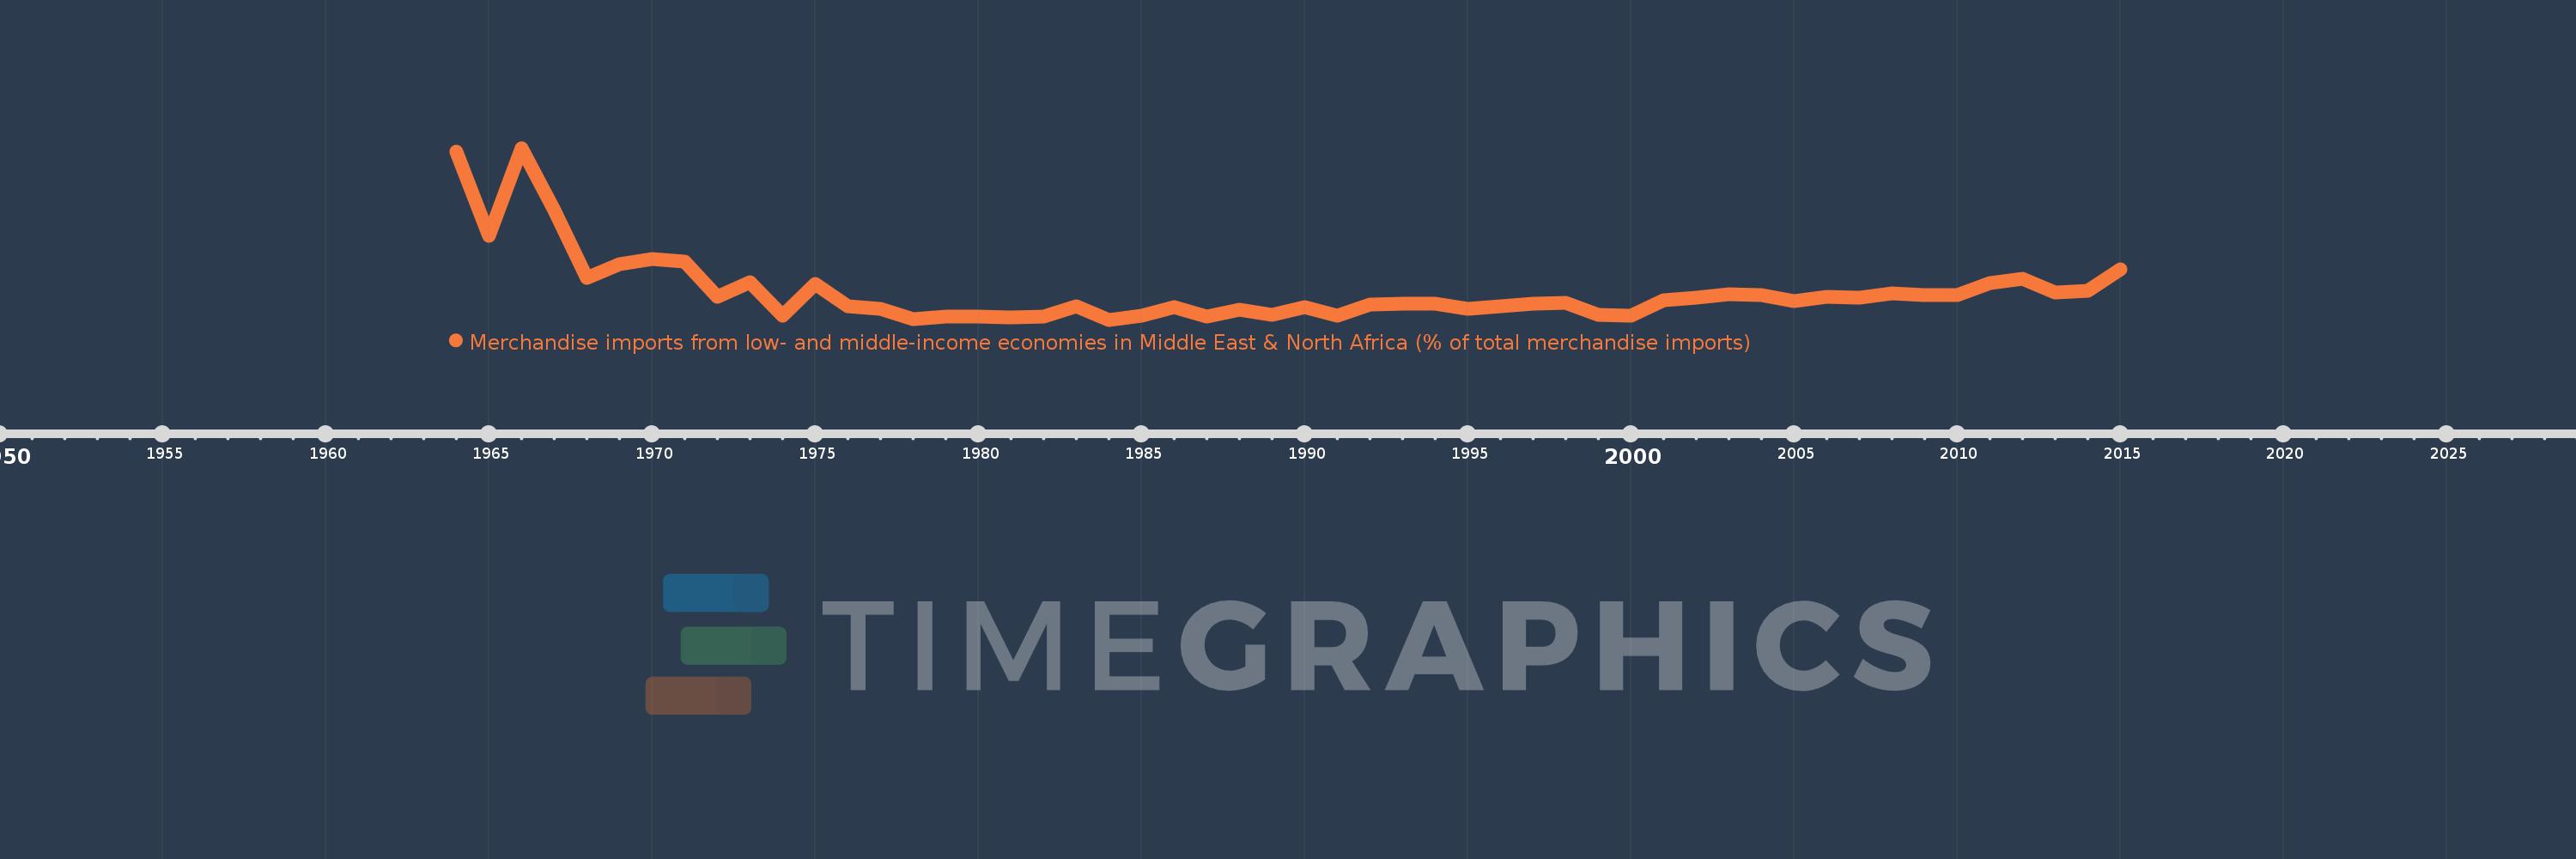
Merchandise imports from low- and middle-income economies in Middle East & North Africa (% of total merchandise imports)
2015,2014,2013,2012,2011,2010,2009,2008,2007,2006,2005,2004,2003,2002,2001,2000,1999,1998,1997,1996,1995,1994,1993,1992,1991,1990,1989,1988,1987,1986,1985,1984,1983,1982,1981,1980,1979,1978,1977,1976,1975,1974,1973,1972,1971,1970,1969,1968,1967,1966,1965,1964
Global statistics library →Mali →Merchandise imports from low- and middle-income economies in Middle East & North Africa (% of total merchandise imports)
This statistics in other country:
AfghanistanAlbaniaAlgeriaAngolaArab WorldArgentinaArmeniaArubaAustraliaAustriaAzerbaijanBahamas, TheBahrainBangladeshBarbadosBelarusBelgiumBelizeBeninBermudaBoliviaBosnia and HerzegovinaBrazilBrunei DarussalamBulgariaBurkina FasoBurundiCabo VerdeCambodiaCameroonCanadaCaribbean small statesCentral African RepublicCentral Europe and the BalticsChadChileChinaColombiaComorosCongo, Dem. Rep.Congo, Rep.Costa RicaCote d'IvoireCroatiaCubaCyprusCzech RepublicDenmarkDjiboutiDominicaDominican RepublicEarly-demographic dividendEast Asia & PacificEast Asia & Pacific (excluding high income)East Asia & Pacific (IDA & IBRD countries)EcuadorEgypt, Arab Rep.El SalvadorEstoniaEthiopiaEuro areaEurope & Central AsiaEurope & Central Asia (excluding high income)Europe & Central Asia (IDA & IBRD countries)European UnionFijiFinlandFragile and conflict affected situationsFranceFrench PolynesiaGabonGambia, TheGeorgiaGermanyGhanaGreeceGreenlandGrenadaGuatemalaGuineaGuinea-BissauGuyanaHaitiHeavily indebted poor countries (HIPC)High incomeHondurasHong Kong SAR, ChinaHungaryIBRD onlyIcelandIDA & IBRD totalIDA blendIDA onlyIDA totalIndiaIndonesiaIran, Islamic Rep.IraqIrelandIsraelItalyJamaicaJapanJordanKazakhstanKenyaKorea, Dem. People’s Rep.Korea, Rep.KosovoKuwaitKyrgyz RepublicLao PDRLate-demographic dividendLatin America & Caribbean Latin America & Caribbean (excluding high income)Latin America & the Caribbean (IDA & IBRD countries)LatviaLeast developed countries: UN classificationLebanonLiberiaLibyaLithuaniaLow & middle incomeLow incomeLower middle incomeLuxembourgMacao SAR, ChinaMacedonia, FYRMadagascarMalawiMalaysiaMaldivesMaliMaltaMauritaniaMauritiusMexicoMiddle East & North AfricaMiddle East & North Africa (excluding high income)Middle East & North Africa (IDA & IBRD countries)Middle incomeMoldovaMongoliaMontenegroMoroccoMozambiqueMyanmarNepalNetherlandsNew CaledoniaNew ZealandNicaraguaNigerNigeriaNorth AmericaNorwayOECD membersOmanOther small statesPacific island small statesPakistanPanamaPapua New GuineaParaguayPeruPhilippinesPolandPortugalPost-demographic dividendPre-demographic dividendQatarRomaniaRussian FederationRwandaSamoaSaudi ArabiaSenegalSerbiaSeychellesSierra LeoneSingaporeSlovak RepublicSloveniaSmall statesSomaliaSouth AfricaSouth AsiaSouth Asia (IDA & IBRD)SpainSri LankaSt. Kitts and NevisSt. LuciaSt. Vincent and the GrenadinesSub-Saharan Africa Sub-Saharan Africa (excluding high income)Sub-Saharan Africa (IDA & IBRD countries)SudanSurinameSwedenSwitzerlandSyrian Arab RepublicTajikistanTanzaniaThailandTogoTrinidad and TobagoTunisiaTurkeyTurkmenistanUgandaUkraineUnited Arab EmiratesUnited KingdomUnited StatesUpper middle incomeUruguayUzbekistanVenezuela, RBVietnamWorldYemen, Rep.ZambiaZimbabwe Timeline:
This timeline shows a graph from 1964 to 2015 of Mali. No data until 1963. Number of actual observations by date: 52.
Source name:
World Development Indicators
Source organization:
World Bank staff estimates based data from International Monetary Fund's Direction of Trade database.
Categories, topics:
Private Sector, Trade
Last updated:
apr 23, 2017
Indicators value changes by year
At the date of observation
Value
Absolute change
Change from previous value
jan 1, 1964
9.384
+9.384
0.0%
jan 1, 1965
4.683
-4.701
-50.09%
jan 1, 1966
9.602
+4.919
105.03%
jan 1, 1967
6.133
-3.469
-36.12%
jan 1, 1968
2.339
-3.794
-61.86%
jan 1, 1969
3.096
+0.757
32.35%
jan 1, 1970
3.423
+0.327
10.57%
jan 1, 1971
3.278
-0.146
-4.25%
jan 1, 1972
1.304
-1.974
-60.21%
jan 1, 1973
2.12
+0.816
62.58%
jan 1, 1974
0.257
-1.863
-87.86%
jan 1, 1975
1.993
+1.735
674.27%
jan 1, 1976
0.758
-1.234
-61.95%
jan 1, 1977
0.625
-0.134
-17.62%
jan 1, 1978
0.071
-0.554
-88.7%
jan 1, 1979
0.2
+0.129
183.42%
jan 1, 1980
0.192
-0.007
-3.74%
jan 1, 1981
0.149
-0.044
-22.7%
jan 1, 1982
0.215
+0.066
44.26%
jan 1, 1983
0.767
+0.552
257.31%
jan 1, 1984
0.016
-0.751
-97.9%
jan 1, 1985
0.226
+0.21
1.31K%
jan 1, 1986
0.724
+0.498
220.64%
jan 1, 1987
0.2
-0.525
-72.45%
jan 1, 1988
0.572
+0.372
186.5%
jan 1, 1989
0.307
-0.265
-46.38%
jan 1, 1990
0.725
+0.419
136.58%
jan 1, 1991
0.242
-0.483
-66.67%
jan 1, 1992
0.852
+0.61
252.45%
jan 1, 1993
0.908
+0.056
6.56%
jan 1, 1994
0.902
-0.006
-0.65%
jan 1, 1995
0.619
-0.283
-31.37%
jan 1, 1996
0.774
+0.155
25.08%
jan 1, 1997
0.906
+0.132
16.99%
jan 1, 1998
0.972
+0.067
7.36%
jan 1, 1999
0.305
-0.667
-68.6%
jan 1, 2000
0.262
-0.043
-14.18%
jan 1, 2001
1.124
+0.862
329.03%
jan 1, 2002
1.257
+0.132
11.77%
jan 1, 2003
1.424
+0.167
13.32%
jan 1, 2004
1.405
-0.019
-1.33%
jan 1, 2005
1.051
-0.354
-25.21%
jan 1, 2006
1.301
+0.251
23.84%
jan 1, 2007
1.263
-0.038
-2.91%
jan 1, 2008
1.468
+0.204
16.17%
jan 1, 2009
1.371
-0.096
-6.57%
jan 1, 2010
1.37
-0.001
-0.11%
jan 1, 2011
2.049
+0.679
49.56%
jan 1, 2012
2.314
+0.265
12.94%
jan 1, 2013
1.555
-0.759
-32.79%
jan 1, 2014
1.617
+0.063
4.02%
jan 1, 2015
2.831
+1.214
75.04%
Ranking of countries by current statistics by years


Comments: