29
/
en
AIzaSyAYiBZKx7MnpbEhh9jyipgxe19OcubqV5w
April 1, 2024
46318
Low income
LIC
false
2
1
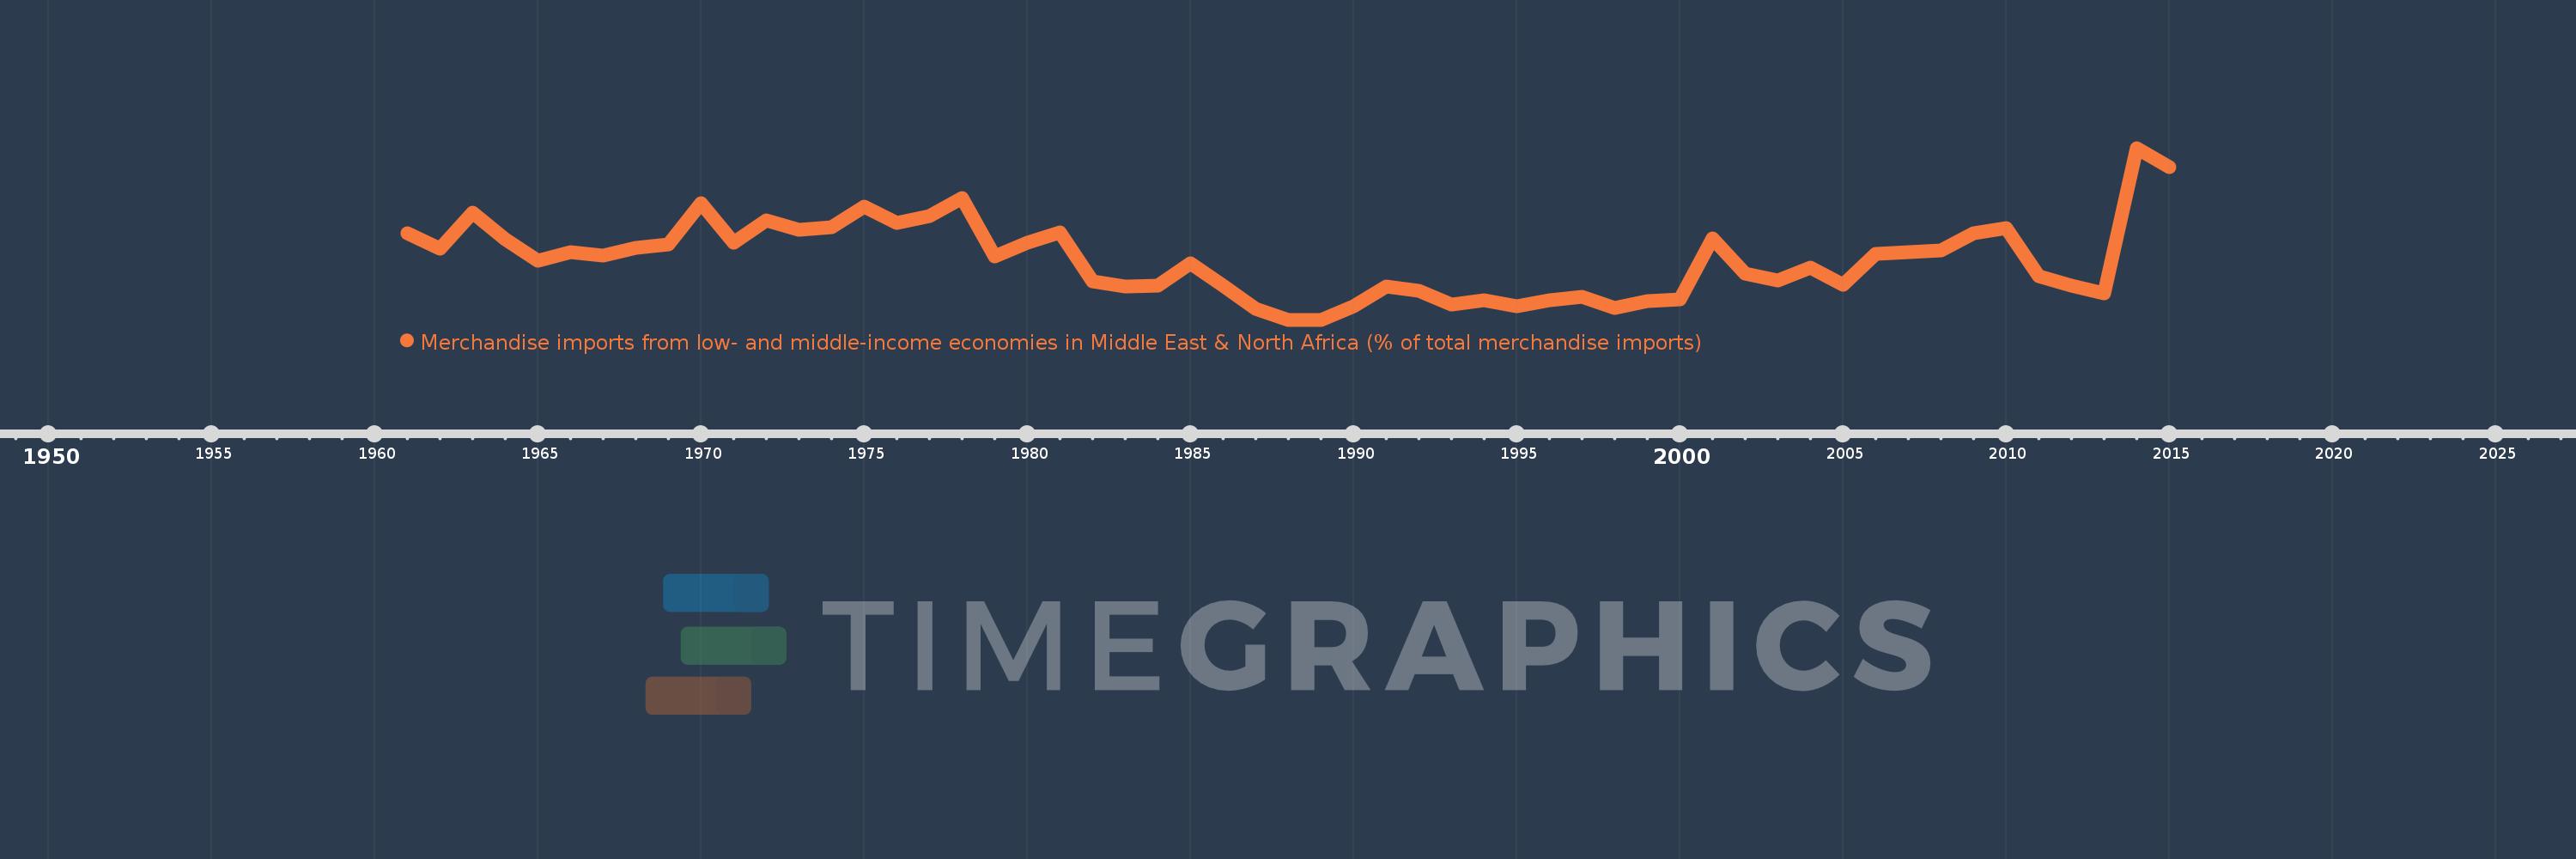
Merchandise imports from low- and middle-income economies in Middle East & North Africa (% of total merchandise imports)
2015,2014,2013,2012,2011,2010,2009,2008,2007,2006,2005,2004,2003,2002,2001,2000,1999,1998,1997,1996,1995,1994,1993,1992,1991,1990,1989,1988,1987,1986,1985,1984,1983,1982,1981,1980,1979,1978,1977,1976,1975,1974,1973,1972,1971,1970,1969,1968,1967,1966,1965,1964,1963,1962,1961
This statistics in other country:
AfghanistanAlbaniaAlgeriaAngolaArab WorldArgentinaArmeniaArubaAustraliaAustriaAzerbaijanBahamas, TheBahrainBangladeshBarbadosBelarusBelgiumBelizeBeninBermudaBoliviaBosnia and HerzegovinaBrazilBrunei DarussalamBulgariaBurkina FasoBurundiCabo VerdeCambodiaCameroonCanadaCaribbean small statesCentral African RepublicCentral Europe and the BalticsChadChileChinaColombiaComorosCongo, Dem. Rep.Congo, Rep.Costa RicaCote d'IvoireCroatiaCubaCyprusCzech RepublicDenmarkDjiboutiDominicaDominican RepublicEarly-demographic dividendEast Asia & PacificEast Asia & Pacific (excluding high income)East Asia & Pacific (IDA & IBRD countries)EcuadorEgypt, Arab Rep.El SalvadorEstoniaEthiopiaEuro areaEurope & Central AsiaEurope & Central Asia (excluding high income)Europe & Central Asia (IDA & IBRD countries)European UnionFijiFinlandFragile and conflict affected situationsFranceFrench PolynesiaGabonGambia, TheGeorgiaGermanyGhanaGreeceGreenlandGrenadaGuatemalaGuineaGuinea-BissauGuyanaHaitiHeavily indebted poor countries (HIPC)High incomeHondurasHong Kong SAR, ChinaHungaryIBRD onlyIcelandIDA & IBRD totalIDA blendIDA onlyIDA totalIndiaIndonesiaIran, Islamic Rep.IraqIrelandIsraelItalyJamaicaJapanJordanKazakhstanKenyaKorea, Dem. People’s Rep.Korea, Rep.KosovoKuwaitKyrgyz RepublicLao PDRLate-demographic dividendLatin America & Caribbean Latin America & Caribbean (excluding high income)Latin America & the Caribbean (IDA & IBRD countries)LatviaLeast developed countries: UN classificationLebanonLiberiaLibyaLithuaniaLow & middle incomeLow incomeLower middle incomeLuxembourgMacao SAR, ChinaMacedonia, FYRMadagascarMalawiMalaysiaMaldivesMaliMaltaMauritaniaMauritiusMexicoMiddle East & North AfricaMiddle East & North Africa (excluding high income)Middle East & North Africa (IDA & IBRD countries)Middle incomeMoldovaMongoliaMontenegroMoroccoMozambiqueMyanmarNepalNetherlandsNew CaledoniaNew ZealandNicaraguaNigerNigeriaNorth AmericaNorwayOECD membersOmanOther small statesPacific island small statesPakistanPanamaPapua New GuineaParaguayPeruPhilippinesPolandPortugalPost-demographic dividendPre-demographic dividendQatarRomaniaRussian FederationRwandaSamoaSaudi ArabiaSenegalSerbiaSeychellesSierra LeoneSingaporeSlovak RepublicSloveniaSmall statesSomaliaSouth AfricaSouth AsiaSouth Asia (IDA & IBRD)SpainSri LankaSt. Kitts and NevisSt. LuciaSt. Vincent and the GrenadinesSub-Saharan Africa Sub-Saharan Africa (excluding high income)Sub-Saharan Africa (IDA & IBRD countries)SudanSurinameSwedenSwitzerlandSyrian Arab RepublicTajikistanTanzaniaThailandTogoTrinidad and TobagoTunisiaTurkeyTurkmenistanUgandaUkraineUnited Arab EmiratesUnited KingdomUnited StatesUpper middle incomeUruguayUzbekistanVenezuela, RBVietnamWorldYemen, Rep.ZambiaZimbabwe Timeline:
This timeline shows a graph from 1961 to 2015 of Low income. No data until 1960. Number of actual observations by date: 55.
Source name:
World Development Indicators
Source organization:
World Bank staff estimates based data from International Monetary Fund's Direction of Trade database.
Categories, topics:
Private Sector, Trade
Last updated:
apr 23, 2017
Indicators value changes by year
At the date of observation
Value
Absolute change
Change from previous value
jan 1, 1961
3.163
+3.163
0.0%
jan 1, 1962
2.705
-0.458
-14.48%
jan 1, 1963
3.753
+1.048
38.74%
jan 1, 1964
2.971
-0.782
-20.83%
jan 1, 1965
2.36
-0.611
-20.56%
jan 1, 1966
2.604
+0.244
10.34%
jan 1, 1967
2.511
-0.094
-3.59%
jan 1, 1968
2.73
+0.219
8.72%
jan 1, 1969
2.835
+0.105
3.84%
jan 1, 1970
4.049
+1.214
42.83%
jan 1, 1971
2.871
-1.178
-29.09%
jan 1, 1972
3.545
+0.674
23.49%
jan 1, 1973
3.252
-0.293
-8.26%
jan 1, 1974
3.327
+0.075
2.3%
jan 1, 1975
3.941
+0.614
18.47%
jan 1, 1976
3.471
-0.47
-11.92%
jan 1, 1977
3.67
+0.199
5.73%
jan 1, 1978
4.18
+0.509
13.88%
jan 1, 1979
2.476
-1.704
-40.77%
jan 1, 1980
2.89
+0.415
16.76%
jan 1, 1981
3.193
+0.303
10.48%
jan 1, 1982
1.75
-1.444
-45.21%
jan 1, 1983
1.59
-0.16
-9.14%
jan 1, 1984
1.609
+0.019
1.18%
jan 1, 1985
2.274
+0.665
41.34%
jan 1, 1986
1.626
-0.648
-28.5%
jan 1, 1987
0.93
-0.696
-42.82%
jan 1, 1988
0.619
-0.31
-33.36%
jan 1, 1989
0.616
-0.003
-0.53%
jan 1, 1990
1.0
+0.384
62.33%
jan 1, 1991
1.582
+0.582
58.15%
jan 1, 1992
1.474
-0.108
-6.81%
jan 1, 1993
1.063
-0.411
-27.86%
jan 1, 1994
1.176
+0.113
10.62%
jan 1, 1995
1.024
-0.153
-13.0%
jan 1, 1996
1.187
+0.163
15.94%
jan 1, 1997
1.301
+0.114
9.62%
jan 1, 1998
0.95
-0.351
-26.98%
jan 1, 1999
1.157
+0.208
21.85%
jan 1, 2000
1.22
+0.062
5.37%
jan 1, 2001
3.013
+1.794
147.07%
jan 1, 2002
1.982
-1.031
-34.23%
jan 1, 2003
1.762
-0.219
-11.07%
jan 1, 2004
2.148
+0.386
21.88%
jan 1, 2005
1.634
-0.514
-23.92%
jan 1, 2006
2.563
+0.929
56.86%
jan 1, 2007
2.596
+0.033
1.28%
jan 1, 2008
2.664
+0.068
2.62%
jan 1, 2009
3.159
+0.494
18.56%
jan 1, 2010
3.31
+0.151
4.78%
jan 1, 2011
1.895
-1.415
-42.75%
jan 1, 2012
1.606
-0.289
-15.27%
jan 1, 2013
1.389
-0.217
-13.49%
jan 1, 2014
5.661
+4.272
307.53%
jan 1, 2015
5.104
-0.557
-9.84%
Ranking of countries by current statistics by years


Comments: