29
/
en
AIzaSyAYiBZKx7MnpbEhh9jyipgxe19OcubqV5w
April 1, 2024
100206
Cameroon
CMR
true
2
1
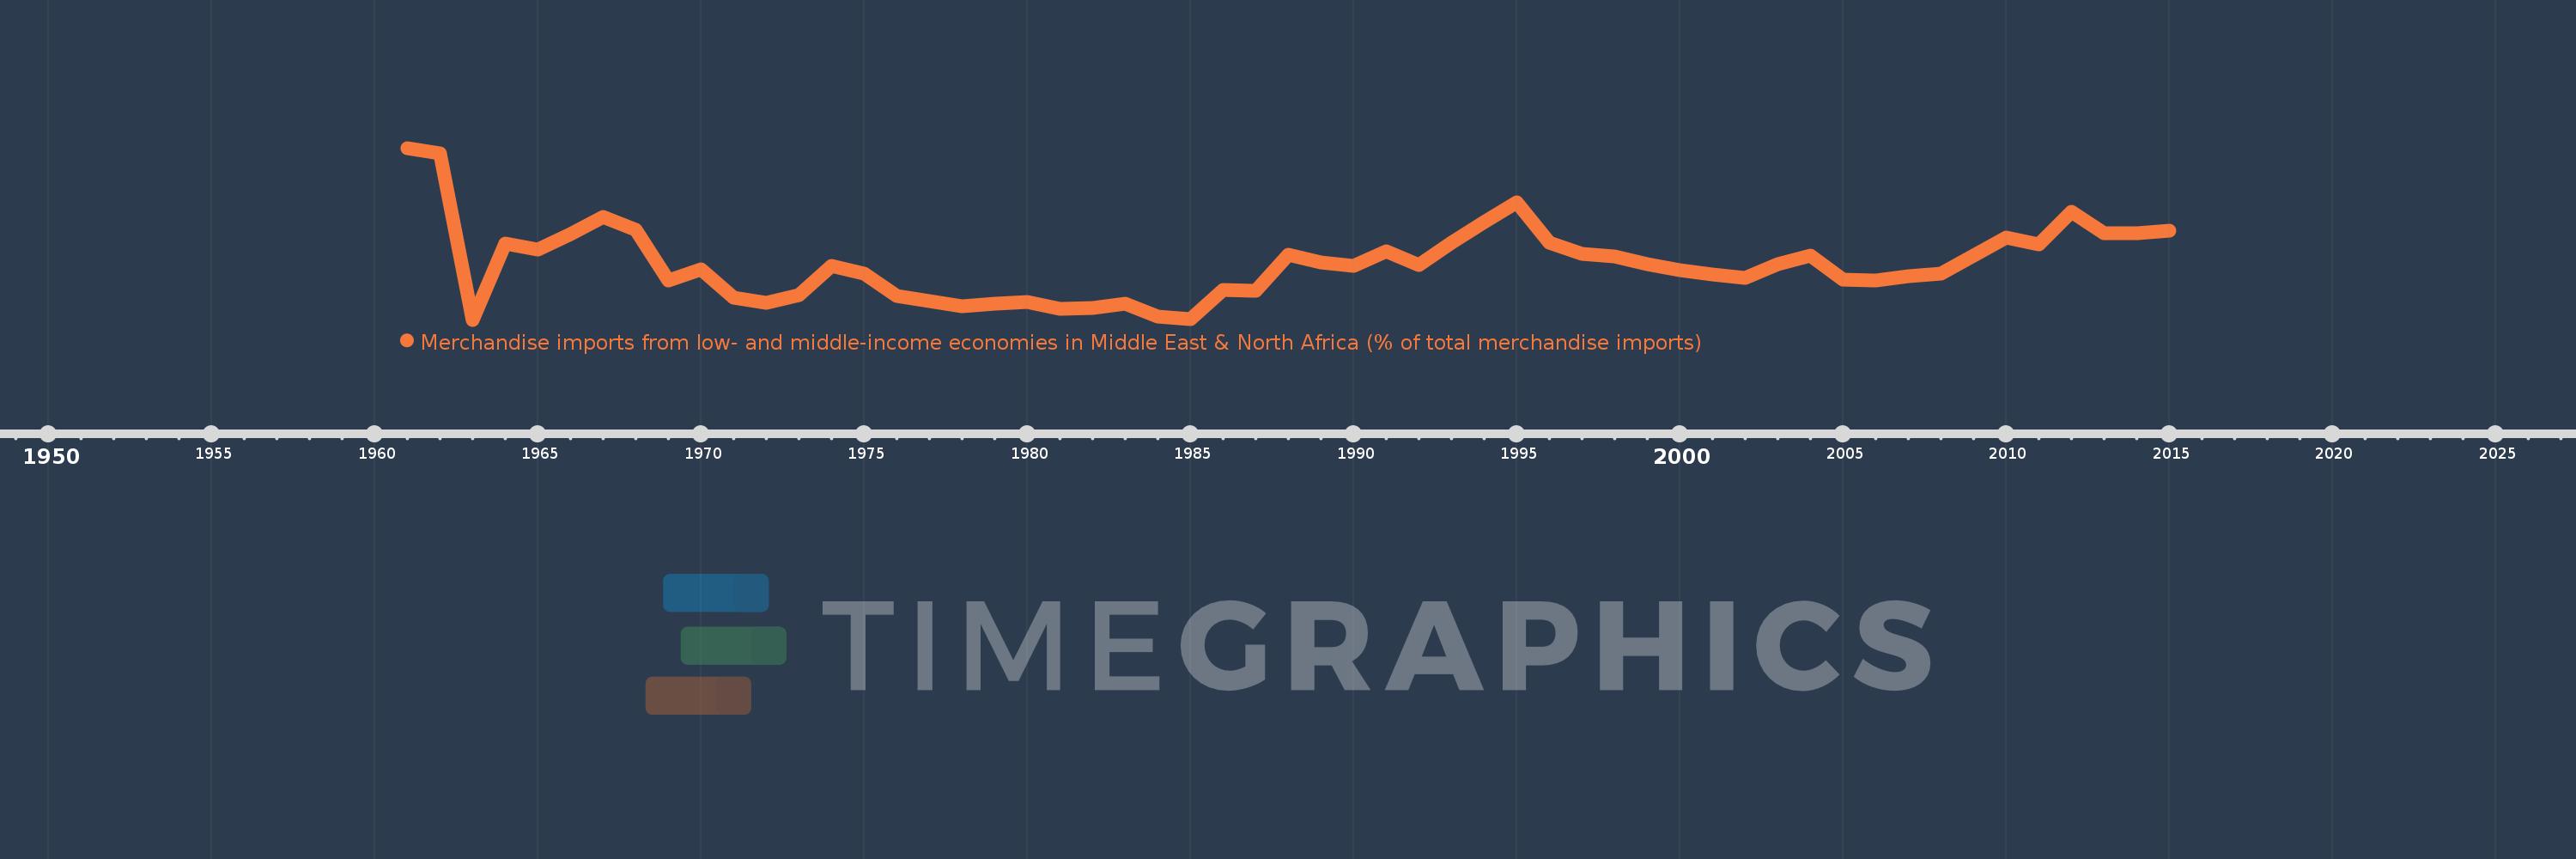
Merchandise imports from low- and middle-income economies in Middle East & North Africa (% of total merchandise imports)
2015,2014,2013,2012,2011,2010,2009,2008,2007,2006,2005,2004,2003,2002,2001,2000,1999,1998,1997,1996,1995,1994,1993,1992,1991,1990,1989,1988,1987,1986,1985,1984,1983,1982,1981,1980,1979,1978,1977,1976,1975,1974,1973,1972,1971,1970,1969,1968,1967,1966,1965,1964,1963,1962,1961
This statistics in other country:
AfghanistanAlbaniaAlgeriaAngolaArab WorldArgentinaArmeniaArubaAustraliaAustriaAzerbaijanBahamas, TheBahrainBangladeshBarbadosBelarusBelgiumBelizeBeninBermudaBoliviaBosnia and HerzegovinaBrazilBrunei DarussalamBulgariaBurkina FasoBurundiCabo VerdeCambodiaCameroonCanadaCaribbean small statesCentral African RepublicCentral Europe and the BalticsChadChileChinaColombiaComorosCongo, Dem. Rep.Congo, Rep.Costa RicaCote d'IvoireCroatiaCubaCyprusCzech RepublicDenmarkDjiboutiDominicaDominican RepublicEarly-demographic dividendEast Asia & PacificEast Asia & Pacific (excluding high income)East Asia & Pacific (IDA & IBRD countries)EcuadorEgypt, Arab Rep.El SalvadorEstoniaEthiopiaEuro areaEurope & Central AsiaEurope & Central Asia (excluding high income)Europe & Central Asia (IDA & IBRD countries)European UnionFijiFinlandFragile and conflict affected situationsFranceFrench PolynesiaGabonGambia, TheGeorgiaGermanyGhanaGreeceGreenlandGrenadaGuatemalaGuineaGuinea-BissauGuyanaHaitiHeavily indebted poor countries (HIPC)High incomeHondurasHong Kong SAR, ChinaHungaryIBRD onlyIcelandIDA & IBRD totalIDA blendIDA onlyIDA totalIndiaIndonesiaIran, Islamic Rep.IraqIrelandIsraelItalyJamaicaJapanJordanKazakhstanKenyaKorea, Dem. People’s Rep.Korea, Rep.KosovoKuwaitKyrgyz RepublicLao PDRLate-demographic dividendLatin America & Caribbean Latin America & Caribbean (excluding high income)Latin America & the Caribbean (IDA & IBRD countries)LatviaLeast developed countries: UN classificationLebanonLiberiaLibyaLithuaniaLow & middle incomeLow incomeLower middle incomeLuxembourgMacao SAR, ChinaMacedonia, FYRMadagascarMalawiMalaysiaMaldivesMaliMaltaMauritaniaMauritiusMexicoMiddle East & North AfricaMiddle East & North Africa (excluding high income)Middle East & North Africa (IDA & IBRD countries)Middle incomeMoldovaMongoliaMontenegroMoroccoMozambiqueMyanmarNepalNetherlandsNew CaledoniaNew ZealandNicaraguaNigerNigeriaNorth AmericaNorwayOECD membersOmanOther small statesPacific island small statesPakistanPanamaPapua New GuineaParaguayPeruPhilippinesPolandPortugalPost-demographic dividendPre-demographic dividendQatarRomaniaRussian FederationRwandaSamoaSaudi ArabiaSenegalSerbiaSeychellesSierra LeoneSingaporeSlovak RepublicSloveniaSmall statesSomaliaSouth AfricaSouth AsiaSouth Asia (IDA & IBRD)SpainSri LankaSt. Kitts and NevisSt. LuciaSt. Vincent and the GrenadinesSub-Saharan Africa Sub-Saharan Africa (excluding high income)Sub-Saharan Africa (IDA & IBRD countries)SudanSurinameSwedenSwitzerlandSyrian Arab RepublicTajikistanTanzaniaThailandTogoTrinidad and TobagoTunisiaTurkeyTurkmenistanUgandaUkraineUnited Arab EmiratesUnited KingdomUnited StatesUpper middle incomeUruguayUzbekistanVenezuela, RBVietnamWorldYemen, Rep.ZambiaZimbabwe Timeline:
This timeline shows a graph from 1961 to 2015 of Cameroon. No data until 1960. Number of actual observations by date: 55.
Source name:
World Development Indicators
Source organization:
World Bank staff estimates based data from International Monetary Fund's Direction of Trade database.
Categories, topics:
Private Sector, Trade
Last updated:
apr 23, 2017
Indicators value changes by year
At the date of observation
Value
Absolute change
Change from previous value
jan 1, 1961
3.567
+3.567
0.0%
jan 1, 1962
3.463
-0.104
-2.93%
jan 1, 1963
0.0
-3.463
-100.0%
jan 1, 1964
1.576
+1.576
%
jan 1, 1965
1.466
-0.11
-6.98%
jan 1, 1966
1.783
+0.318
21.67%
jan 1, 1967
2.136
+0.353
19.78%
jan 1, 1968
1.864
-0.271
-12.71%
jan 1, 1969
0.821
-1.044
-55.99%
jan 1, 1970
1.044
+0.223
27.19%
jan 1, 1971
0.451
-0.593
-56.81%
jan 1, 1972
0.344
-0.106
-23.59%
jan 1, 1973
0.505
+0.16
46.49%
jan 1, 1974
1.113
+0.609
120.66%
jan 1, 1975
0.966
-0.147
-13.24%
jan 1, 1976
0.486
-0.48
-49.65%
jan 1, 1977
0.379
-0.107
-22.09%
jan 1, 1978
0.281
-0.098
-25.84%
jan 1, 1979
0.325
+0.044
15.75%
jan 1, 1980
0.367
+0.042
12.84%
jan 1, 1981
0.228
-0.139
-37.98%
jan 1, 1982
0.252
+0.025
10.85%
jan 1, 1983
0.329
+0.077
30.42%
jan 1, 1984
0.071
-0.258
-78.48%
jan 1, 1985
0.019
-0.052
-73.81%
jan 1, 1986
0.626
+0.608
3.28K%
jan 1, 1987
0.605
-0.021
-3.33%
jan 1, 1988
1.351
+0.746
123.16%
jan 1, 1989
1.192
-0.159
-11.79%
jan 1, 1990
1.116
-0.076
-6.34%
jan 1, 1991
1.421
+0.305
27.31%
jan 1, 1992
1.134
-0.287
-20.2%
jan 1, 1993
1.605
+0.471
41.53%
jan 1, 1994
2.034
+0.429
26.72%
jan 1, 1995
2.436
+0.402
19.78%
jan 1, 1996
1.598
-0.838
-34.42%
jan 1, 1997
1.365
-0.232
-14.55%
jan 1, 1998
1.306
-0.059
-4.35%
jan 1, 1999
1.147
-0.159
-12.14%
jan 1, 2000
1.03
-0.117
-10.22%
jan 1, 2001
0.939
-0.091
-8.79%
jan 1, 2002
0.862
-0.078
-8.28%
jan 1, 2003
1.157
+0.295
34.29%
jan 1, 2004
1.34
+0.183
15.78%
jan 1, 2005
0.835
-0.505
-37.69%
jan 1, 2006
0.808
-0.026
-3.17%
jan 1, 2007
0.902
+0.094
11.65%
jan 1, 2008
0.957
+0.055
6.05%
jan 1, 2009
1.33
+0.373
39.02%
jan 1, 2010
1.714
+0.384
28.84%
jan 1, 2011
1.573
-0.141
-8.21%
jan 1, 2012
2.233
+0.66
41.94%
jan 1, 2013
1.793
-0.44
-19.69%
jan 1, 2014
1.804
+0.011
0.6%
jan 1, 2015
1.848
+0.044
2.46%
Ranking of countries by current statistics by years


Comments: