29
/
en
AIzaSyAYiBZKx7MnpbEhh9jyipgxe19OcubqV5w
April 1, 2024
44444
Least developed countries: UN classification
LDC
false
2
1
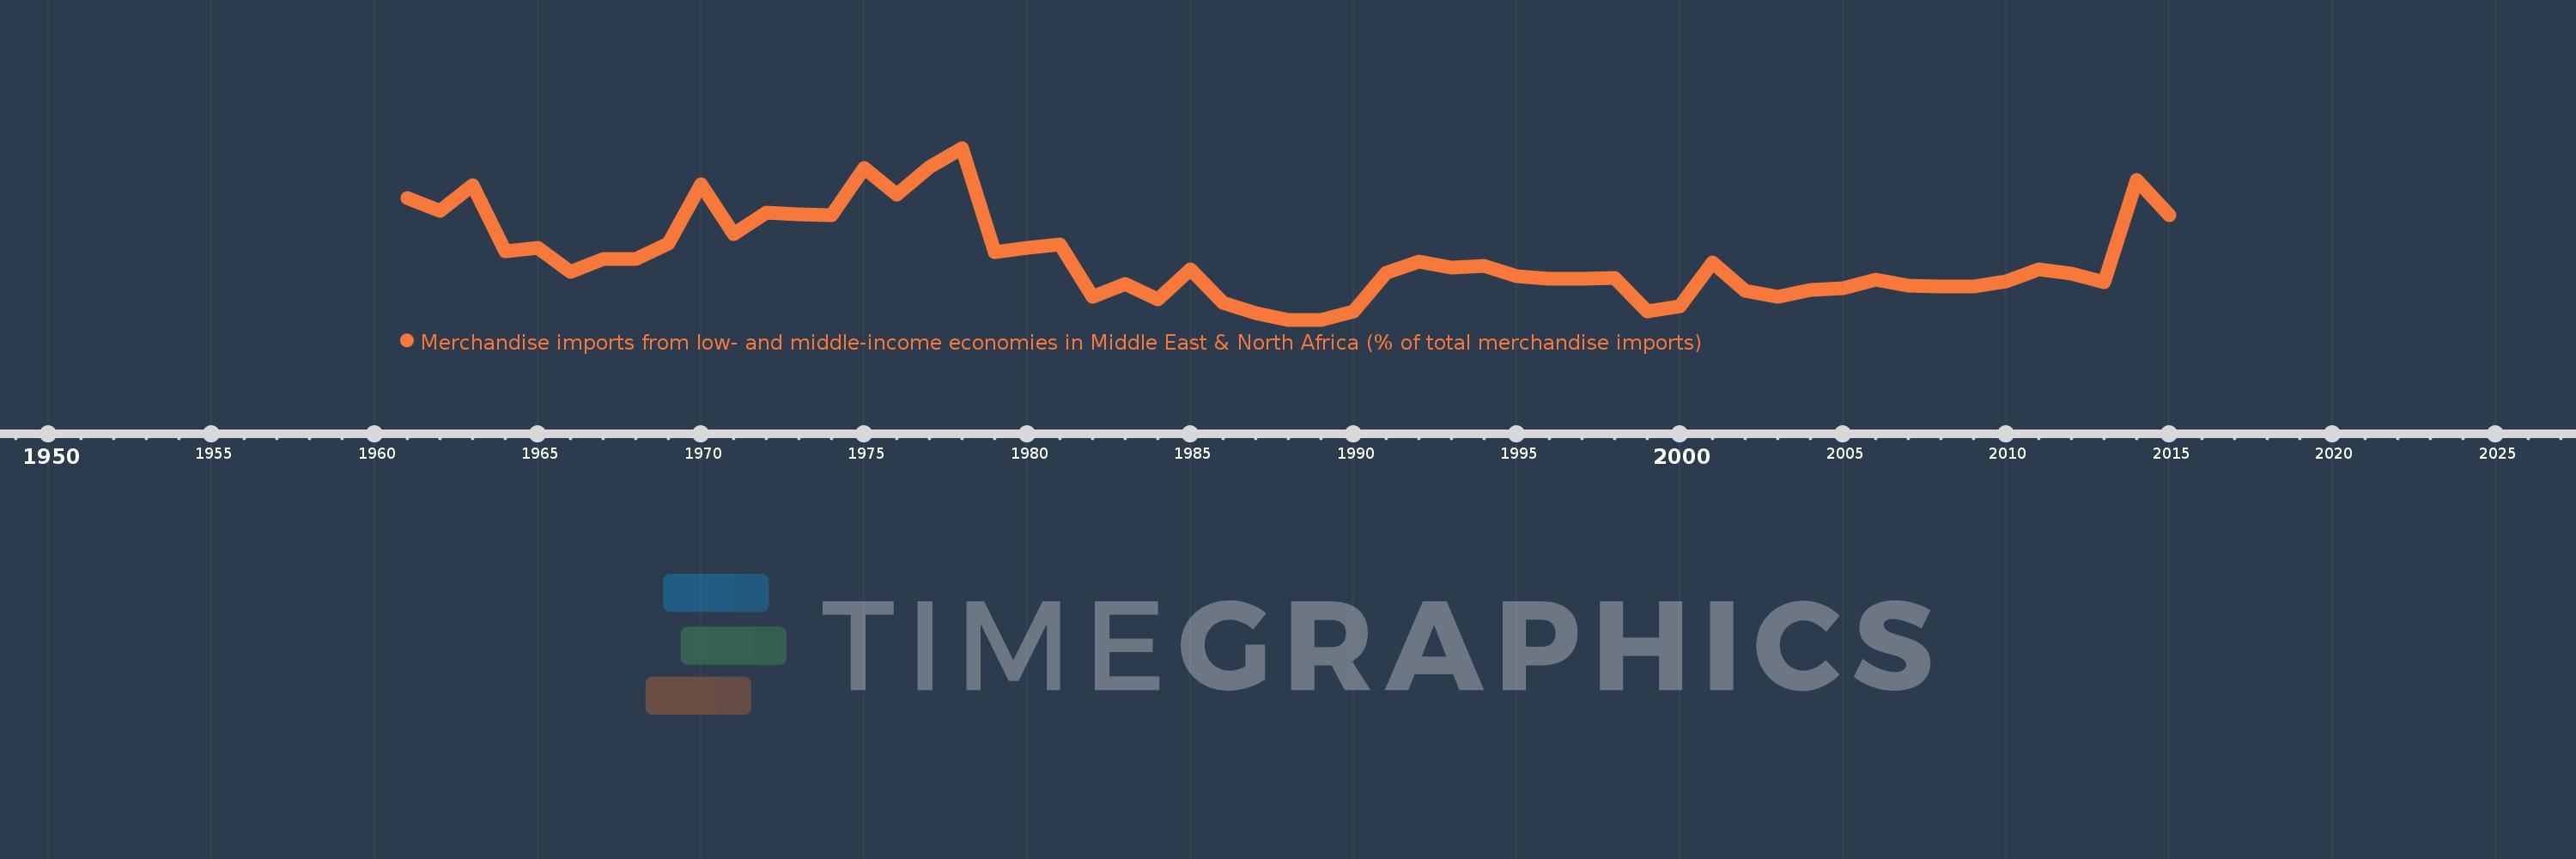
Merchandise imports from low- and middle-income economies in Middle East & North Africa (% of total merchandise imports)
2015,2014,2013,2012,2011,2010,2009,2008,2007,2006,2005,2004,2003,2002,2001,2000,1999,1998,1997,1996,1995,1994,1993,1992,1991,1990,1989,1988,1987,1986,1985,1984,1983,1982,1981,1980,1979,1978,1977,1976,1975,1974,1973,1972,1971,1970,1969,1968,1967,1966,1965,1964,1963,1962,1961
This statistics in other country:
AfghanistanAlbaniaAlgeriaAngolaArab WorldArgentinaArmeniaArubaAustraliaAustriaAzerbaijanBahamas, TheBahrainBangladeshBarbadosBelarusBelgiumBelizeBeninBermudaBoliviaBosnia and HerzegovinaBrazilBrunei DarussalamBulgariaBurkina FasoBurundiCabo VerdeCambodiaCameroonCanadaCaribbean small statesCentral African RepublicCentral Europe and the BalticsChadChileChinaColombiaComorosCongo, Dem. Rep.Congo, Rep.Costa RicaCote d'IvoireCroatiaCubaCyprusCzech RepublicDenmarkDjiboutiDominicaDominican RepublicEarly-demographic dividendEast Asia & PacificEast Asia & Pacific (excluding high income)East Asia & Pacific (IDA & IBRD countries)EcuadorEgypt, Arab Rep.El SalvadorEstoniaEthiopiaEuro areaEurope & Central AsiaEurope & Central Asia (excluding high income)Europe & Central Asia (IDA & IBRD countries)European UnionFijiFinlandFragile and conflict affected situationsFranceFrench PolynesiaGabonGambia, TheGeorgiaGermanyGhanaGreeceGreenlandGrenadaGuatemalaGuineaGuinea-BissauGuyanaHaitiHeavily indebted poor countries (HIPC)High incomeHondurasHong Kong SAR, ChinaHungaryIBRD onlyIcelandIDA & IBRD totalIDA blendIDA onlyIDA totalIndiaIndonesiaIran, Islamic Rep.IraqIrelandIsraelItalyJamaicaJapanJordanKazakhstanKenyaKorea, Dem. People’s Rep.Korea, Rep.KosovoKuwaitKyrgyz RepublicLao PDRLate-demographic dividendLatin America & Caribbean Latin America & Caribbean (excluding high income)Latin America & the Caribbean (IDA & IBRD countries)LatviaLeast developed countries: UN classificationLebanonLiberiaLibyaLithuaniaLow & middle incomeLow incomeLower middle incomeLuxembourgMacao SAR, ChinaMacedonia, FYRMadagascarMalawiMalaysiaMaldivesMaliMaltaMauritaniaMauritiusMexicoMiddle East & North AfricaMiddle East & North Africa (excluding high income)Middle East & North Africa (IDA & IBRD countries)Middle incomeMoldovaMongoliaMontenegroMoroccoMozambiqueMyanmarNepalNetherlandsNew CaledoniaNew ZealandNicaraguaNigerNigeriaNorth AmericaNorwayOECD membersOmanOther small statesPacific island small statesPakistanPanamaPapua New GuineaParaguayPeruPhilippinesPolandPortugalPost-demographic dividendPre-demographic dividendQatarRomaniaRussian FederationRwandaSamoaSaudi ArabiaSenegalSerbiaSeychellesSierra LeoneSingaporeSlovak RepublicSloveniaSmall statesSomaliaSouth AfricaSouth AsiaSouth Asia (IDA & IBRD)SpainSri LankaSt. Kitts and NevisSt. LuciaSt. Vincent and the GrenadinesSub-Saharan Africa Sub-Saharan Africa (excluding high income)Sub-Saharan Africa (IDA & IBRD countries)SudanSurinameSwedenSwitzerlandSyrian Arab RepublicTajikistanTanzaniaThailandTogoTrinidad and TobagoTunisiaTurkeyTurkmenistanUgandaUkraineUnited Arab EmiratesUnited KingdomUnited StatesUpper middle incomeUruguayUzbekistanVenezuela, RBVietnamWorldYemen, Rep.ZambiaZimbabwe Timeline:
This timeline shows a graph from 1961 to 2015 of Least developed countries: UN classification. No data until 1960. Number of actual observations by date: 55.
Source name:
World Development Indicators
Source organization:
World Bank staff estimates based data from International Monetary Fund's Direction of Trade database.
Categories, topics:
Private Sector, Trade
Last updated:
apr 23, 2017
Indicators value changes by year
At the date of observation
Value
Absolute change
Change from previous value
jan 1, 1961
3.598
+3.598
0.0%
jan 1, 1962
3.314
-0.284
-7.9%
jan 1, 1963
3.871
+0.558
16.83%
jan 1, 1964
2.443
-1.428
-36.89%
jan 1, 1965
2.522
+0.078
3.21%
jan 1, 1966
1.998
-0.524
-20.77%
jan 1, 1967
2.268
+0.27
13.5%
jan 1, 1968
2.283
+0.016
0.68%
jan 1, 1969
2.615
+0.331
14.52%
jan 1, 1970
3.893
+1.278
48.88%
jan 1, 1971
2.814
-1.079
-27.71%
jan 1, 1972
3.269
+0.455
16.18%
jan 1, 1973
3.242
-0.027
-0.84%
jan 1, 1974
3.211
-0.031
-0.95%
jan 1, 1975
4.232
+1.021
31.79%
jan 1, 1976
3.673
-0.559
-13.2%
jan 1, 1977
4.26
+0.586
15.96%
jan 1, 1978
4.673
+0.413
9.69%
jan 1, 1979
2.417
-2.256
-48.28%
jan 1, 1980
2.516
+0.099
4.12%
jan 1, 1981
2.595
+0.078
3.11%
jan 1, 1982
1.466
-1.128
-43.49%
jan 1, 1983
1.733
+0.266
18.17%
jan 1, 1984
1.407
-0.326
-18.82%
jan 1, 1985
2.056
+0.649
46.17%
jan 1, 1986
1.322
-0.733
-35.67%
jan 1, 1987
1.112
-0.211
-15.92%
jan 1, 1988
0.963
-0.149
-13.41%
jan 1, 1989
0.962
0.0
-0.04%
jan 1, 1990
1.142
+0.179
18.61%
jan 1, 1991
1.972
+0.83
72.71%
jan 1, 1992
2.218
+0.246
12.48%
jan 1, 1993
2.093
-0.125
-5.62%
jan 1, 1994
2.123
+0.03
1.42%
jan 1, 1995
1.903
-0.22
-10.36%
jan 1, 1996
1.851
-0.051
-2.7%
jan 1, 1997
1.852
+0.001
0.04%
jan 1, 1998
1.871
+0.019
1.01%
jan 1, 1999
1.135
-0.736
-39.33%
jan 1, 2000
1.262
+0.127
11.18%
jan 1, 2001
2.198
+0.937
74.23%
jan 1, 2002
1.582
-0.616
-28.04%
jan 1, 2003
1.457
-0.125
-7.92%
jan 1, 2004
1.61
+0.154
10.56%
jan 1, 2005
1.635
+0.024
1.52%
jan 1, 2006
1.828
+0.193
11.82%
jan 1, 2007
1.702
-0.126
-6.87%
jan 1, 2008
1.674
-0.029
-1.69%
jan 1, 2009
1.678
+0.004
0.24%
jan 1, 2010
1.8
+0.122
7.3%
jan 1, 2011
2.059
+0.259
14.41%
jan 1, 2012
1.959
-0.101
-4.9%
jan 1, 2013
1.764
-0.195
-9.95%
jan 1, 2014
3.972
+2.208
125.21%
jan 1, 2015
3.22
-0.752
-18.93%
Ranking of countries by current statistics by years


Comments: