29
/
en
AIzaSyAYiBZKx7MnpbEhh9jyipgxe19OcubqV5w
April 1, 2024
113874
Cote d'Ivoire
CIV
true
2
1
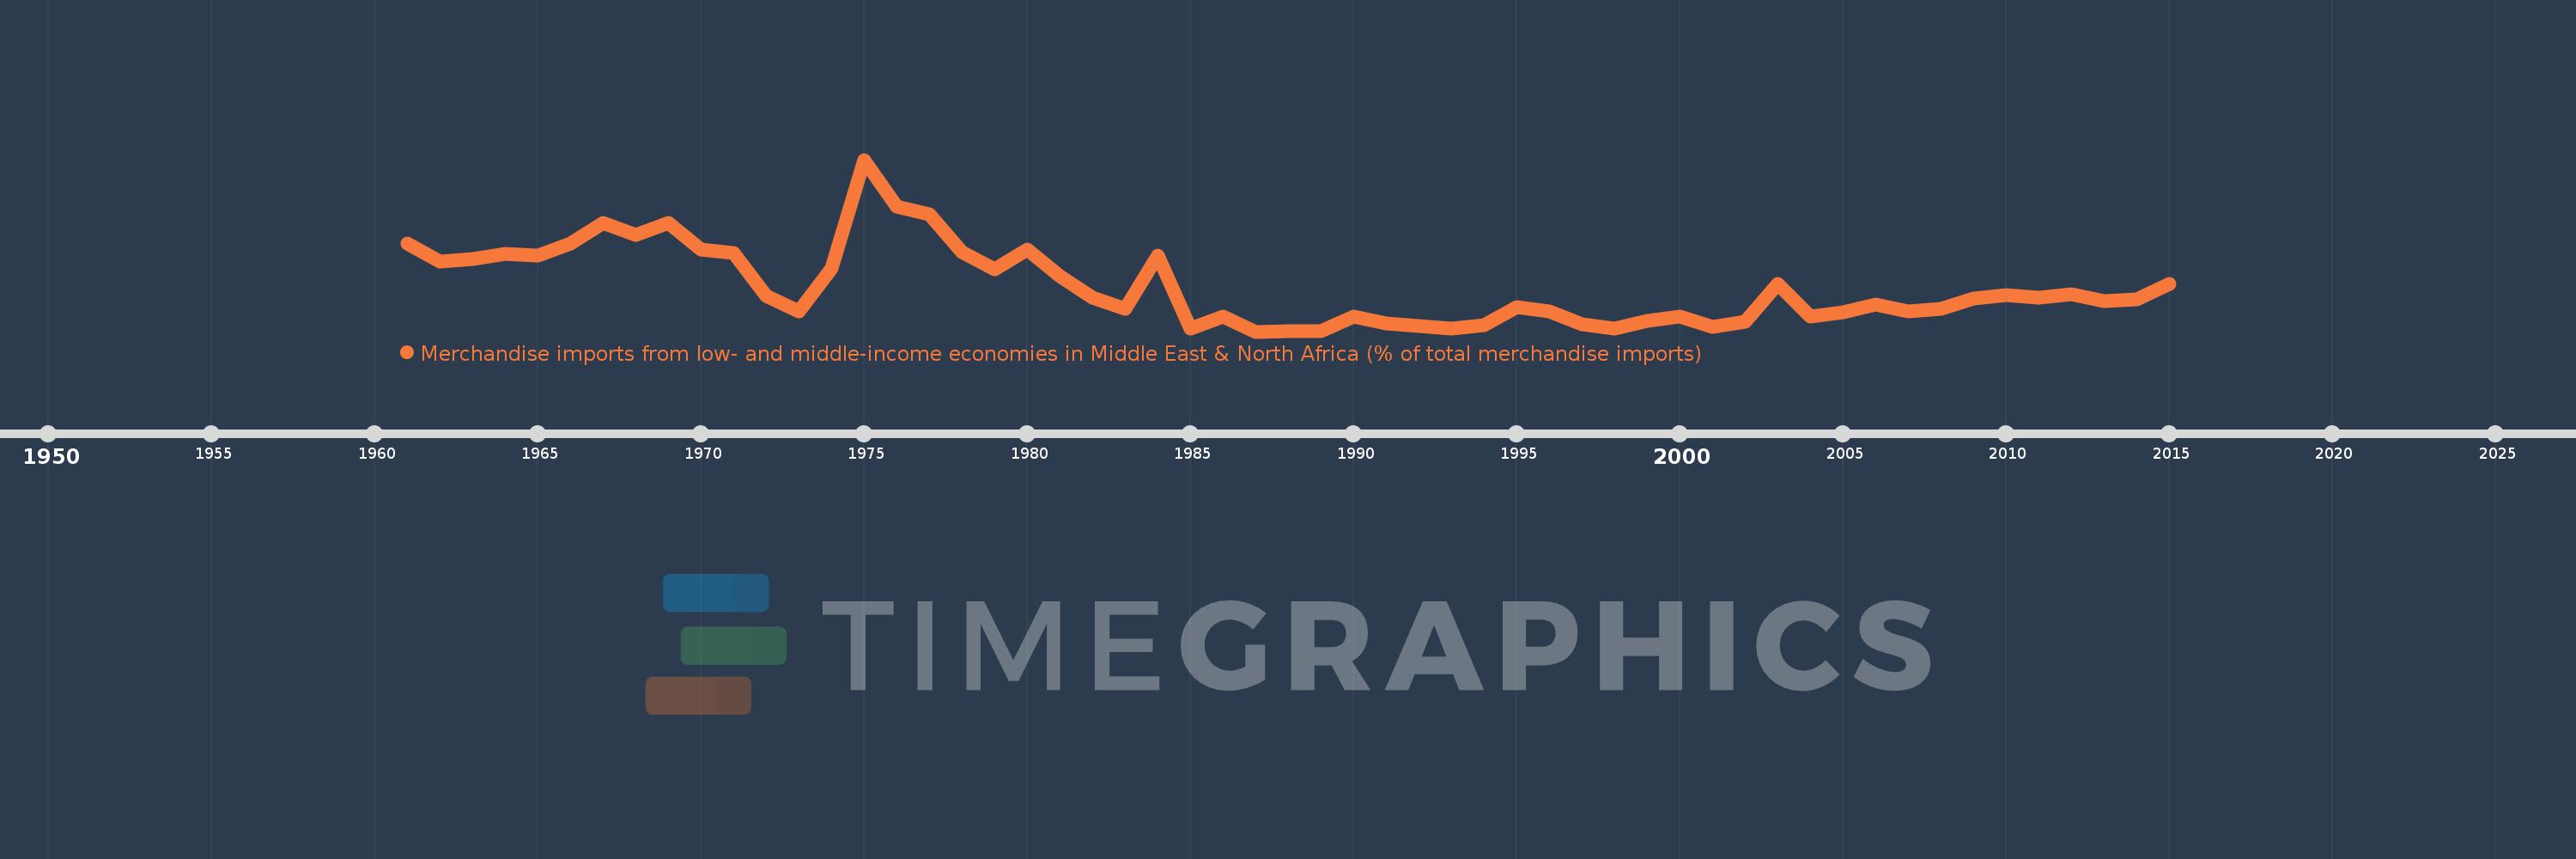
Merchandise imports from low- and middle-income economies in Middle East & North Africa (% of total merchandise imports)
2015,2014,2013,2012,2011,2010,2009,2008,2007,2006,2005,2004,2003,2002,2001,2000,1999,1998,1997,1996,1995,1994,1993,1992,1991,1990,1989,1988,1987,1986,1985,1984,1983,1982,1981,1980,1979,1978,1977,1976,1975,1974,1973,1972,1971,1970,1969,1968,1967,1966,1965,1964,1963,1962,1961
This statistics in other country:
AfghanistanAlbaniaAlgeriaAngolaArab WorldArgentinaArmeniaArubaAustraliaAustriaAzerbaijanBahamas, TheBahrainBangladeshBarbadosBelarusBelgiumBelizeBeninBermudaBoliviaBosnia and HerzegovinaBrazilBrunei DarussalamBulgariaBurkina FasoBurundiCabo VerdeCambodiaCameroonCanadaCaribbean small statesCentral African RepublicCentral Europe and the BalticsChadChileChinaColombiaComorosCongo, Dem. Rep.Congo, Rep.Costa RicaCote d'IvoireCroatiaCubaCyprusCzech RepublicDenmarkDjiboutiDominicaDominican RepublicEarly-demographic dividendEast Asia & PacificEast Asia & Pacific (excluding high income)East Asia & Pacific (IDA & IBRD countries)EcuadorEgypt, Arab Rep.El SalvadorEstoniaEthiopiaEuro areaEurope & Central AsiaEurope & Central Asia (excluding high income)Europe & Central Asia (IDA & IBRD countries)European UnionFijiFinlandFragile and conflict affected situationsFranceFrench PolynesiaGabonGambia, TheGeorgiaGermanyGhanaGreeceGreenlandGrenadaGuatemalaGuineaGuinea-BissauGuyanaHaitiHeavily indebted poor countries (HIPC)High incomeHondurasHong Kong SAR, ChinaHungaryIBRD onlyIcelandIDA & IBRD totalIDA blendIDA onlyIDA totalIndiaIndonesiaIran, Islamic Rep.IraqIrelandIsraelItalyJamaicaJapanJordanKazakhstanKenyaKorea, Dem. People’s Rep.Korea, Rep.KosovoKuwaitKyrgyz RepublicLao PDRLate-demographic dividendLatin America & Caribbean Latin America & Caribbean (excluding high income)Latin America & the Caribbean (IDA & IBRD countries)LatviaLeast developed countries: UN classificationLebanonLiberiaLibyaLithuaniaLow & middle incomeLow incomeLower middle incomeLuxembourgMacao SAR, ChinaMacedonia, FYRMadagascarMalawiMalaysiaMaldivesMaliMaltaMauritaniaMauritiusMexicoMiddle East & North AfricaMiddle East & North Africa (excluding high income)Middle East & North Africa (IDA & IBRD countries)Middle incomeMoldovaMongoliaMontenegroMoroccoMozambiqueMyanmarNepalNetherlandsNew CaledoniaNew ZealandNicaraguaNigerNigeriaNorth AmericaNorwayOECD membersOmanOther small statesPacific island small statesPakistanPanamaPapua New GuineaParaguayPeruPhilippinesPolandPortugalPost-demographic dividendPre-demographic dividendQatarRomaniaRussian FederationRwandaSamoaSaudi ArabiaSenegalSerbiaSeychellesSierra LeoneSingaporeSlovak RepublicSloveniaSmall statesSomaliaSouth AfricaSouth AsiaSouth Asia (IDA & IBRD)SpainSri LankaSt. Kitts and NevisSt. LuciaSt. Vincent and the GrenadinesSub-Saharan Africa Sub-Saharan Africa (excluding high income)Sub-Saharan Africa (IDA & IBRD countries)SudanSurinameSwedenSwitzerlandSyrian Arab RepublicTajikistanTanzaniaThailandTogoTrinidad and TobagoTunisiaTurkeyTurkmenistanUgandaUkraineUnited Arab EmiratesUnited KingdomUnited StatesUpper middle incomeUruguayUzbekistanVenezuela, RBVietnamWorldYemen, Rep.ZambiaZimbabwe Timeline:
This timeline shows a graph from 1961 to 2015 of Cote d'Ivoire. No data until 1960. Number of actual observations by date: 55.
Source name:
World Development Indicators
Source organization:
World Bank staff estimates based data from International Monetary Fund's Direction of Trade database.
Categories, topics:
Private Sector, Trade
Last updated:
apr 23, 2017
Indicators value changes by year
At the date of observation
Value
Absolute change
Change from previous value
jan 1, 1961
4.72
+4.72
0.0%
jan 1, 1962
3.861
-0.859
-18.2%
jan 1, 1963
3.969
+0.108
2.8%
jan 1, 1964
4.238
+0.269
6.76%
jan 1, 1965
4.131
-0.107
-2.52%
jan 1, 1966
4.705
+0.575
13.91%
jan 1, 1967
5.707
+1.001
21.28%
jan 1, 1968
5.158
-0.549
-9.62%
jan 1, 1969
5.742
+0.584
11.32%
jan 1, 1970
4.438
-1.304
-22.71%
jan 1, 1971
4.278
-0.16
-3.6%
jan 1, 1972
2.181
-2.098
-49.03%
jan 1, 1973
1.412
-0.769
-35.26%
jan 1, 1974
3.518
+2.106
149.2%
jan 1, 1975
8.792
+5.274
149.93%
jan 1, 1976
6.499
-2.293
-26.08%
jan 1, 1977
6.133
-0.366
-5.63%
jan 1, 1978
4.313
-1.82
-29.67%
jan 1, 1979
3.487
-0.826
-19.15%
jan 1, 1980
4.426
+0.938
26.91%
jan 1, 1981
3.115
-1.311
-29.62%
jan 1, 1982
2.106
-1.009
-32.39%
jan 1, 1983
1.56
-0.546
-25.92%
jan 1, 1984
4.146
+2.586
165.76%
jan 1, 1985
0.567
-3.579
-86.32%
jan 1, 1986
1.185
+0.618
108.95%
jan 1, 1987
0.438
-0.747
-63.01%
jan 1, 1988
0.462
+0.023
5.35%
jan 1, 1989
0.442
-0.019
-4.19%
jan 1, 1990
1.168
+0.725
163.97%
jan 1, 1991
0.853
-0.315
-26.95%
jan 1, 1992
0.729
-0.124
-14.54%
jan 1, 1993
0.585
-0.144
-19.76%
jan 1, 1994
0.747
+0.162
27.65%
jan 1, 1995
1.611
+0.864
115.73%
jan 1, 1996
1.42
-0.191
-11.84%
jan 1, 1997
0.806
-0.614
-43.22%
jan 1, 1998
0.584
-0.223
-27.63%
jan 1, 1999
0.945
+0.362
61.98%
jan 1, 2000
1.18
+0.234
24.79%
jan 1, 2001
0.679
-0.5
-42.4%
jan 1, 2002
0.924
+0.245
36.05%
jan 1, 2003
2.773
+1.849
200.02%
jan 1, 2004
1.153
-1.62
-58.42%
jan 1, 2005
1.389
+0.236
20.43%
jan 1, 2006
1.762
+0.374
26.91%
jan 1, 2007
1.415
-0.347
-19.71%
jan 1, 2008
1.544
+0.129
9.13%
jan 1, 2009
2.035
+0.491
31.8%
jan 1, 2010
2.216
+0.181
8.89%
jan 1, 2011
2.068
-0.148
-6.68%
jan 1, 2012
2.241
+0.174
8.39%
jan 1, 2013
1.938
-0.303
-13.53%
jan 1, 2014
2.006
+0.068
3.51%
jan 1, 2015
2.754
+0.748
37.27%
Ranking of countries by current statistics by years


Comments: