29
/
en
AIzaSyAYiBZKx7MnpbEhh9jyipgxe19OcubqV5w
April 1, 2024
31830
Europe & Central Asia (excluding high income)
ECA
false
2
1
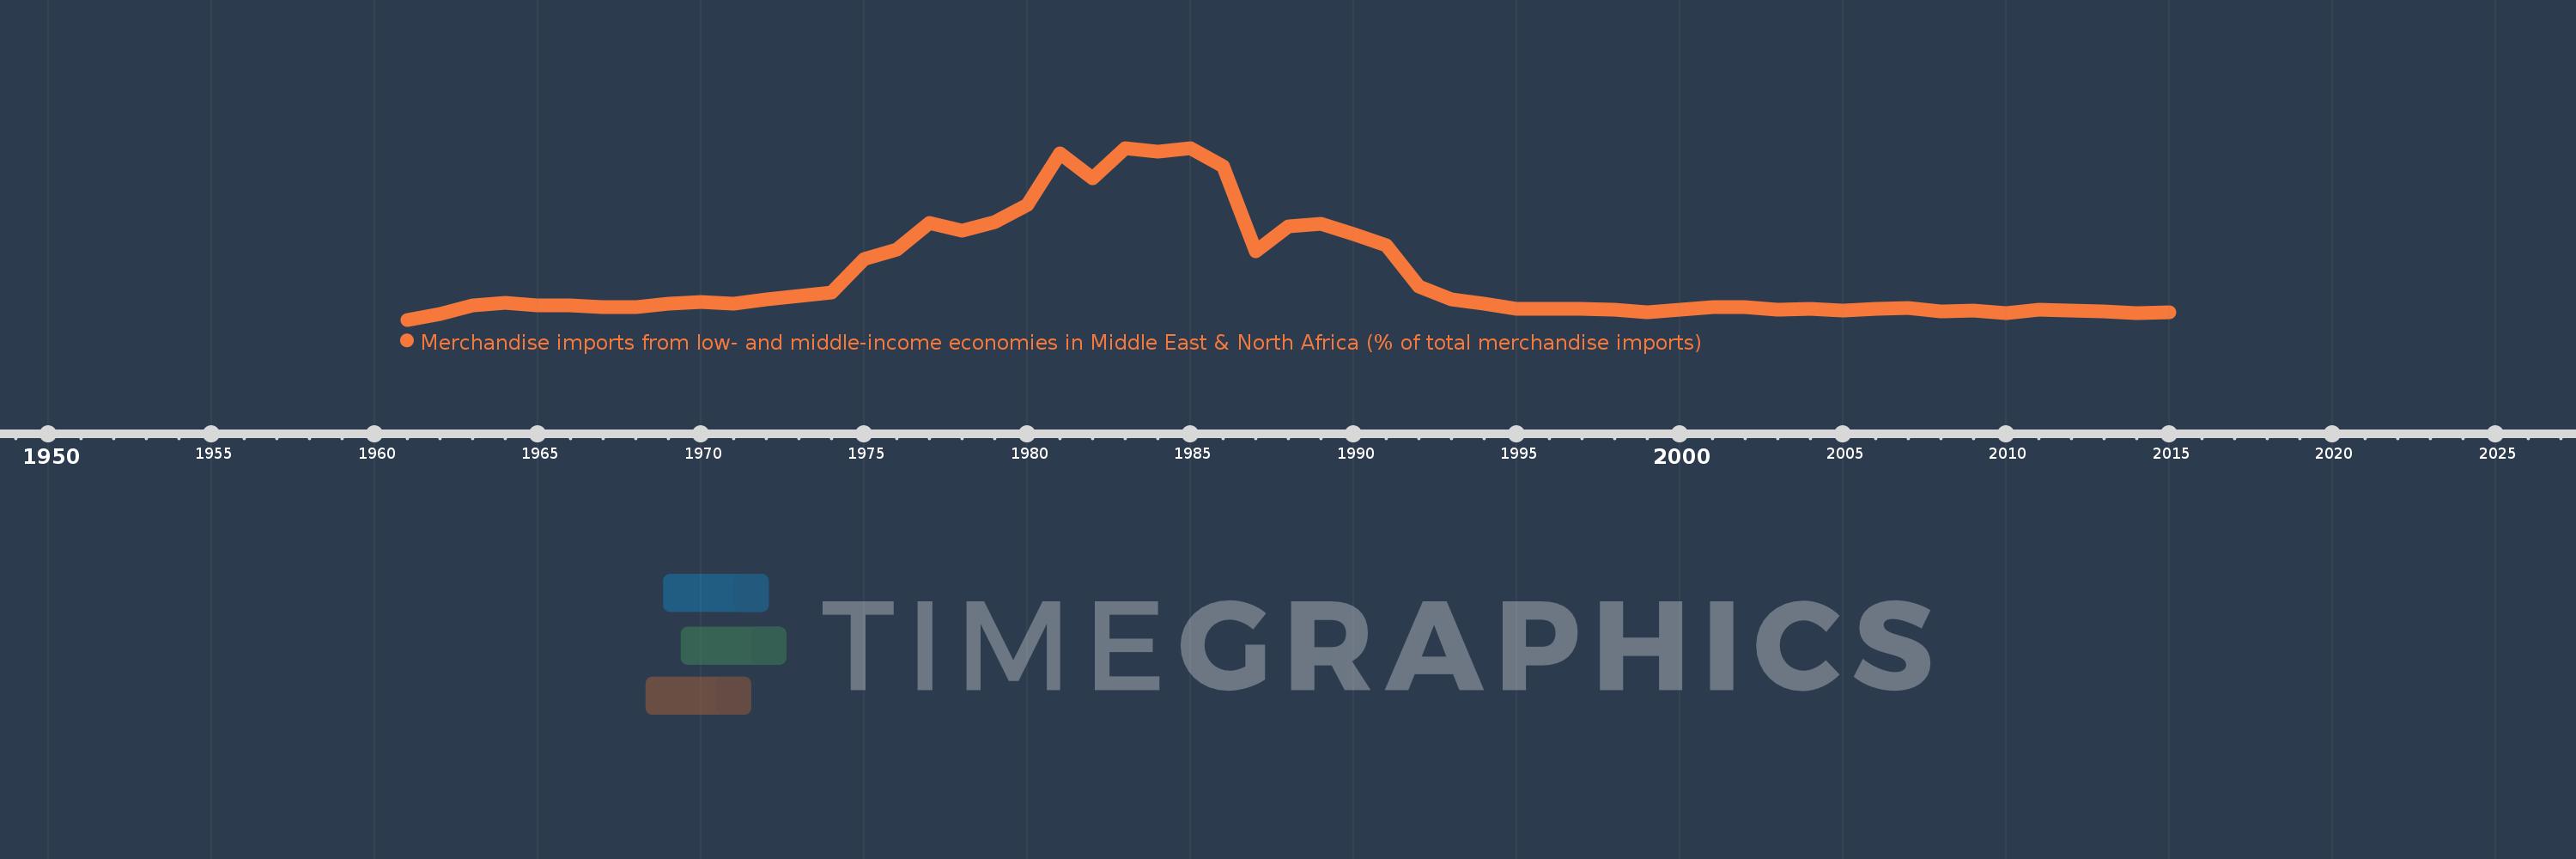
Merchandise imports from low- and middle-income economies in Middle East & North Africa (% of total merchandise imports)
2015,2014,2013,2012,2011,2010,2009,2008,2007,2006,2005,2004,2003,2002,2001,2000,1999,1998,1997,1996,1995,1994,1993,1992,1991,1990,1989,1988,1987,1986,1985,1984,1983,1982,1981,1980,1979,1978,1977,1976,1975,1974,1973,1972,1971,1970,1969,1968,1967,1966,1965,1964,1963,1962,1961
This statistics in other country:
AfghanistanAlbaniaAlgeriaAngolaArab WorldArgentinaArmeniaArubaAustraliaAustriaAzerbaijanBahamas, TheBahrainBangladeshBarbadosBelarusBelgiumBelizeBeninBermudaBoliviaBosnia and HerzegovinaBrazilBrunei DarussalamBulgariaBurkina FasoBurundiCabo VerdeCambodiaCameroonCanadaCaribbean small statesCentral African RepublicCentral Europe and the BalticsChadChileChinaColombiaComorosCongo, Dem. Rep.Congo, Rep.Costa RicaCote d'IvoireCroatiaCubaCyprusCzech RepublicDenmarkDjiboutiDominicaDominican RepublicEarly-demographic dividendEast Asia & PacificEast Asia & Pacific (excluding high income)East Asia & Pacific (IDA & IBRD countries)EcuadorEgypt, Arab Rep.El SalvadorEstoniaEthiopiaEuro areaEurope & Central AsiaEurope & Central Asia (excluding high income)Europe & Central Asia (IDA & IBRD countries)European UnionFijiFinlandFragile and conflict affected situationsFranceFrench PolynesiaGabonGambia, TheGeorgiaGermanyGhanaGreeceGreenlandGrenadaGuatemalaGuineaGuinea-BissauGuyanaHaitiHeavily indebted poor countries (HIPC)High incomeHondurasHong Kong SAR, ChinaHungaryIBRD onlyIcelandIDA & IBRD totalIDA blendIDA onlyIDA totalIndiaIndonesiaIran, Islamic Rep.IraqIrelandIsraelItalyJamaicaJapanJordanKazakhstanKenyaKorea, Dem. People’s Rep.Korea, Rep.KosovoKuwaitKyrgyz RepublicLao PDRLate-demographic dividendLatin America & Caribbean Latin America & Caribbean (excluding high income)Latin America & the Caribbean (IDA & IBRD countries)LatviaLeast developed countries: UN classificationLebanonLiberiaLibyaLithuaniaLow & middle incomeLow incomeLower middle incomeLuxembourgMacao SAR, ChinaMacedonia, FYRMadagascarMalawiMalaysiaMaldivesMaliMaltaMauritaniaMauritiusMexicoMiddle East & North AfricaMiddle East & North Africa (excluding high income)Middle East & North Africa (IDA & IBRD countries)Middle incomeMoldovaMongoliaMontenegroMoroccoMozambiqueMyanmarNepalNetherlandsNew CaledoniaNew ZealandNicaraguaNigerNigeriaNorth AmericaNorwayOECD membersOmanOther small statesPacific island small statesPakistanPanamaPapua New GuineaParaguayPeruPhilippinesPolandPortugalPost-demographic dividendPre-demographic dividendQatarRomaniaRussian FederationRwandaSamoaSaudi ArabiaSenegalSerbiaSeychellesSierra LeoneSingaporeSlovak RepublicSloveniaSmall statesSomaliaSouth AfricaSouth AsiaSouth Asia (IDA & IBRD)SpainSri LankaSt. Kitts and NevisSt. LuciaSt. Vincent and the GrenadinesSub-Saharan Africa Sub-Saharan Africa (excluding high income)Sub-Saharan Africa (IDA & IBRD countries)SudanSurinameSwedenSwitzerlandSyrian Arab RepublicTajikistanTanzaniaThailandTogoTrinidad and TobagoTunisiaTurkeyTurkmenistanUgandaUkraineUnited Arab EmiratesUnited KingdomUnited StatesUpper middle incomeUruguayUzbekistanVenezuela, RBVietnamWorldYemen, Rep.ZambiaZimbabwe Timeline:
This timeline shows a graph from 1961 to 2015 of Europe & Central Asia (excluding high income). No data until 1960. Number of actual observations by date: 55.
Source name:
World Development Indicators
Source organization:
World Bank staff estimates based data from International Monetary Fund's Direction of Trade database.
Categories, topics:
Private Sector, Trade
Last updated:
apr 23, 2017
Indicators value changes by year
Maximum:
26.765
jan 1, 1985
At the date of observation
Value
Absolute change
Change from previous value
jan 1, 1961
0.936
+0.936
0.0%
jan 1, 1962
1.796
+0.86
91.83%
jan 1, 1963
3.14
+1.344
74.81%
jan 1, 1964
3.514
+0.373
11.89%
jan 1, 1965
3.113
-0.4
-11.39%
jan 1, 1966
3.104
-0.009
-0.3%
jan 1, 1967
2.843
-0.261
-8.4%
jan 1, 1968
2.785
-0.058
-2.04%
jan 1, 1969
3.381
+0.596
21.4%
jan 1, 1970
3.628
+0.247
7.31%
jan 1, 1971
3.398
-0.231
-6.36%
jan 1, 1972
4.06
+0.662
19.49%
jan 1, 1973
4.47
+0.41
10.11%
jan 1, 1974
5.009
+0.539
12.05%
jan 1, 1975
10.08
+5.071
101.24%
jan 1, 1976
11.494
+1.414
14.03%
jan 1, 1977
15.509
+4.015
34.93%
jan 1, 1978
14.298
-1.211
-7.81%
jan 1, 1979
15.568
+1.27
8.88%
jan 1, 1980
18.205
+2.637
16.94%
jan 1, 1981
25.914
+7.708
42.34%
jan 1, 1982
22.218
-3.696
-14.26%
jan 1, 1983
26.71
+4.492
20.22%
jan 1, 1984
26.254
-0.456
-1.71%
jan 1, 1985
26.765
+0.511
1.95%
jan 1, 1986
24.072
-2.694
-10.06%
jan 1, 1987
11.292
-12.779
-53.09%
jan 1, 1988
14.987
+3.695
32.72%
jan 1, 1989
15.385
+0.398
2.66%
jan 1, 1990
13.817
-1.569
-10.19%
jan 1, 1991
12.118
-1.698
-12.29%
jan 1, 1992
5.896
-6.223
-51.35%
jan 1, 1993
3.934
-1.962
-33.28%
jan 1, 1994
3.357
-0.576
-14.65%
jan 1, 1995
2.628
-0.729
-21.7%
jan 1, 1996
2.585
-0.044
-1.67%
jan 1, 1997
2.62
+0.036
1.37%
jan 1, 1998
2.474
-0.146
-5.57%
jan 1, 1999
2.002
-0.472
-19.09%
jan 1, 2000
2.467
+0.466
23.25%
jan 1, 2001
2.828
+0.36
14.61%
jan 1, 2002
2.814
-0.013
-0.47%
jan 1, 2003
2.496
-0.318
-11.31%
jan 1, 2004
2.518
+0.022
0.86%
jan 1, 2005
2.358
-0.16
-6.34%
jan 1, 2006
2.63
+0.272
11.54%
jan 1, 2007
2.726
+0.095
3.63%
jan 1, 2008
2.165
-0.56
-20.56%
jan 1, 2009
2.306
+0.141
6.52%
jan 1, 2010
1.91
-0.396
-17.17%
jan 1, 2011
2.488
+0.578
30.23%
jan 1, 2012
2.294
-0.194
-7.8%
jan 1, 2013
2.142
-0.152
-6.63%
jan 1, 2014
1.97
-0.172
-8.05%
jan 1, 2015
2.1
+0.13
6.6%
Ranking of countries by current statistics by years


Comments: