29
/
en
AIzaSyAYiBZKx7MnpbEhh9jyipgxe19OcubqV5w
April 1, 2024
73233
Australia
AUS
true
2
1
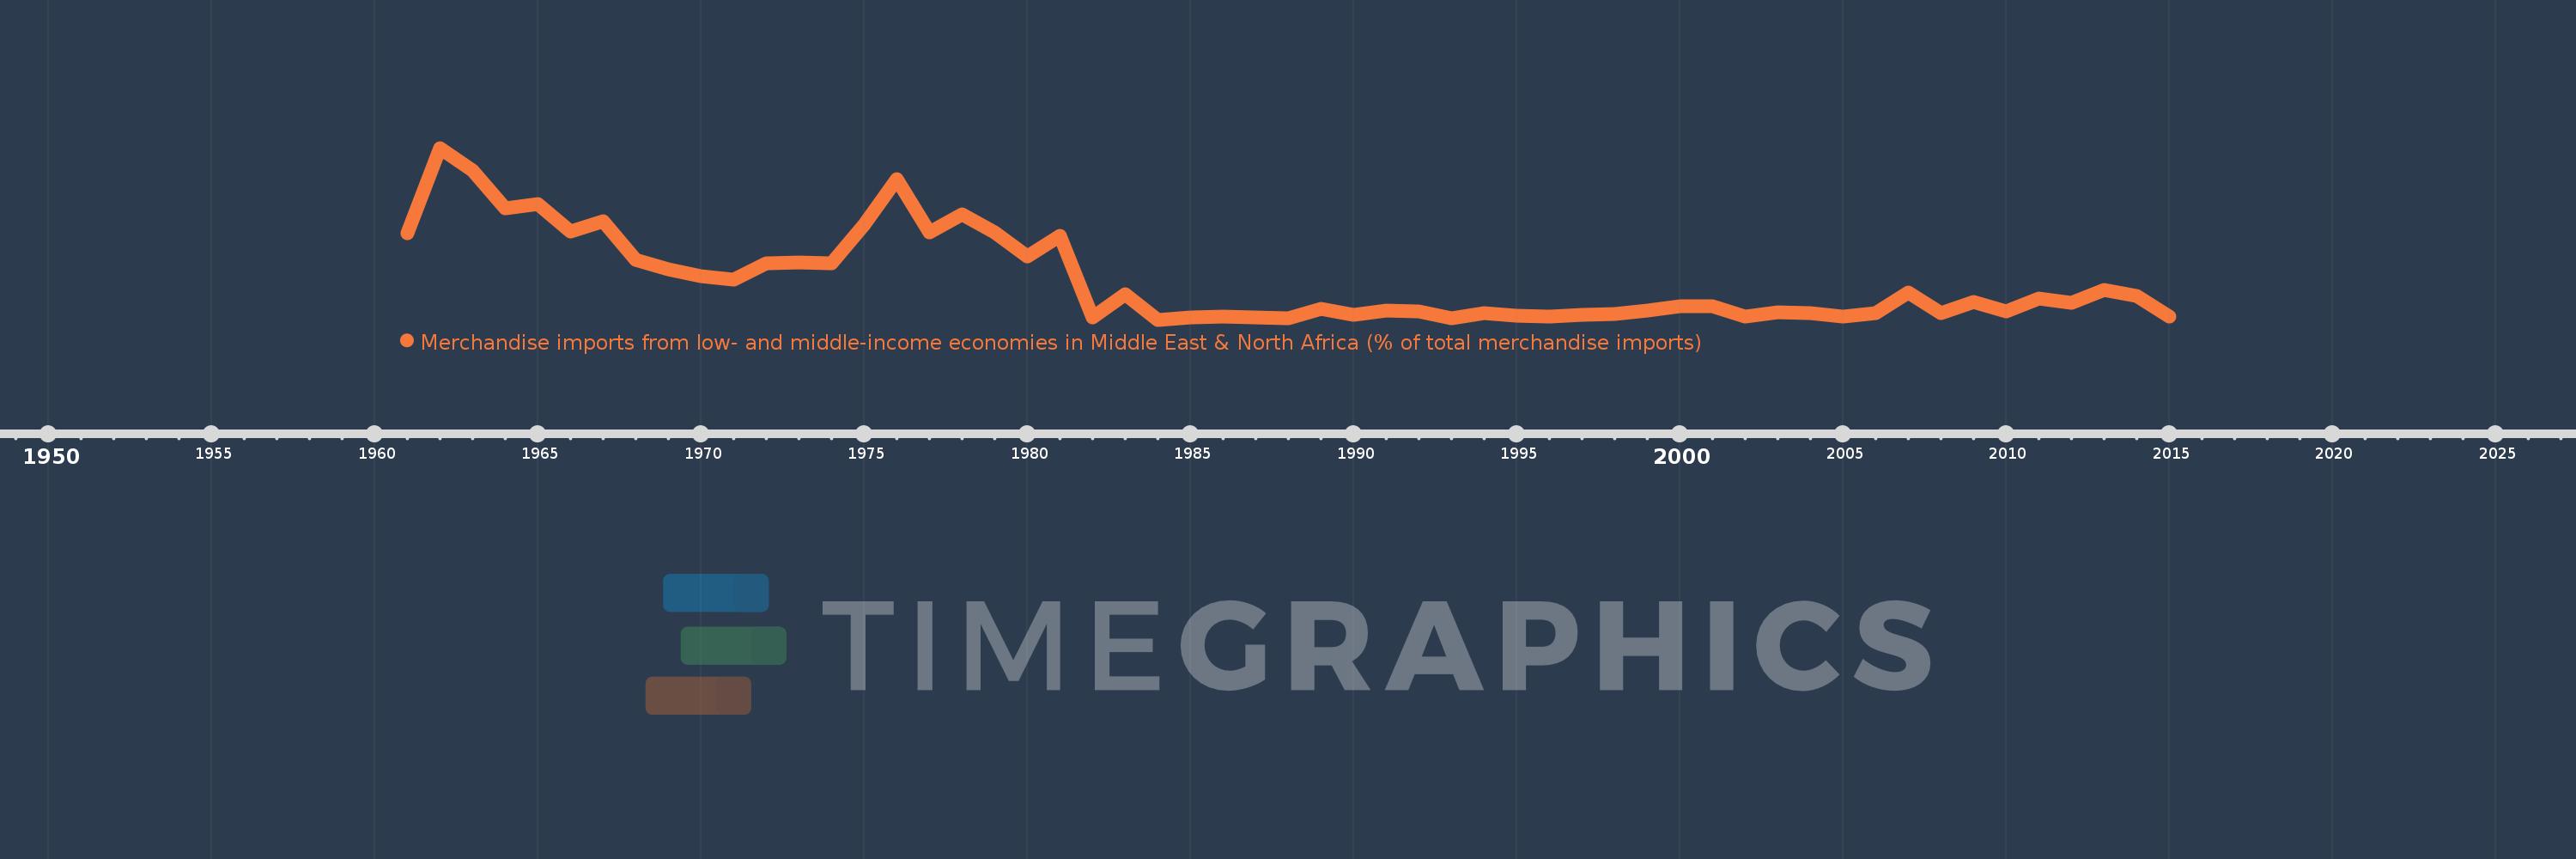
Merchandise imports from low- and middle-income economies in Middle East & North Africa (% of total merchandise imports)
2015,2014,2013,2012,2011,2010,2009,2008,2007,2006,2005,2004,2003,2002,2001,2000,1999,1998,1997,1996,1995,1994,1993,1992,1991,1990,1989,1988,1987,1986,1985,1984,1983,1982,1981,1980,1979,1978,1977,1976,1975,1974,1973,1972,1971,1970,1969,1968,1967,1966,1965,1964,1963,1962,1961
This statistics in other country:
AfghanistanAlbaniaAlgeriaAngolaArab WorldArgentinaArmeniaArubaAustraliaAustriaAzerbaijanBahamas, TheBahrainBangladeshBarbadosBelarusBelgiumBelizeBeninBermudaBoliviaBosnia and HerzegovinaBrazilBrunei DarussalamBulgariaBurkina FasoBurundiCabo VerdeCambodiaCameroonCanadaCaribbean small statesCentral African RepublicCentral Europe and the BalticsChadChileChinaColombiaComorosCongo, Dem. Rep.Congo, Rep.Costa RicaCote d'IvoireCroatiaCubaCyprusCzech RepublicDenmarkDjiboutiDominicaDominican RepublicEarly-demographic dividendEast Asia & PacificEast Asia & Pacific (excluding high income)East Asia & Pacific (IDA & IBRD countries)EcuadorEgypt, Arab Rep.El SalvadorEstoniaEthiopiaEuro areaEurope & Central AsiaEurope & Central Asia (excluding high income)Europe & Central Asia (IDA & IBRD countries)European UnionFijiFinlandFragile and conflict affected situationsFranceFrench PolynesiaGabonGambia, TheGeorgiaGermanyGhanaGreeceGreenlandGrenadaGuatemalaGuineaGuinea-BissauGuyanaHaitiHeavily indebted poor countries (HIPC)High incomeHondurasHong Kong SAR, ChinaHungaryIBRD onlyIcelandIDA & IBRD totalIDA blendIDA onlyIDA totalIndiaIndonesiaIran, Islamic Rep.IraqIrelandIsraelItalyJamaicaJapanJordanKazakhstanKenyaKorea, Dem. People’s Rep.Korea, Rep.KosovoKuwaitKyrgyz RepublicLao PDRLate-demographic dividendLatin America & Caribbean Latin America & Caribbean (excluding high income)Latin America & the Caribbean (IDA & IBRD countries)LatviaLeast developed countries: UN classificationLebanonLiberiaLibyaLithuaniaLow & middle incomeLow incomeLower middle incomeLuxembourgMacao SAR, ChinaMacedonia, FYRMadagascarMalawiMalaysiaMaldivesMaliMaltaMauritaniaMauritiusMexicoMiddle East & North AfricaMiddle East & North Africa (excluding high income)Middle East & North Africa (IDA & IBRD countries)Middle incomeMoldovaMongoliaMontenegroMoroccoMozambiqueMyanmarNepalNetherlandsNew CaledoniaNew ZealandNicaraguaNigerNigeriaNorth AmericaNorwayOECD membersOmanOther small statesPacific island small statesPakistanPanamaPapua New GuineaParaguayPeruPhilippinesPolandPortugalPost-demographic dividendPre-demographic dividendQatarRomaniaRussian FederationRwandaSamoaSaudi ArabiaSenegalSerbiaSeychellesSierra LeoneSingaporeSlovak RepublicSloveniaSmall statesSomaliaSouth AfricaSouth AsiaSouth Asia (IDA & IBRD)SpainSri LankaSt. Kitts and NevisSt. LuciaSt. Vincent and the GrenadinesSub-Saharan Africa Sub-Saharan Africa (excluding high income)Sub-Saharan Africa (IDA & IBRD countries)SudanSurinameSwedenSwitzerlandSyrian Arab RepublicTajikistanTanzaniaThailandTogoTrinidad and TobagoTunisiaTurkeyTurkmenistanUgandaUkraineUnited Arab EmiratesUnited KingdomUnited StatesUpper middle incomeUruguayUzbekistanVenezuela, RBVietnamWorldYemen, Rep.ZambiaZimbabwe Timeline:
This timeline shows a graph from 1961 to 2015 of Australia. No data until 1960. Number of actual observations by date: 55.
Source name:
World Development Indicators
Source organization:
World Bank staff estimates based data from International Monetary Fund's Direction of Trade database.
Categories, topics:
Private Sector, Trade
Last updated:
apr 23, 2017
Indicators value changes by year
At the date of observation
Value
Absolute change
Change from previous value
jan 1, 1961
1.464
+1.464
0.0%
jan 1, 1962
2.871
+1.407
96.06%
jan 1, 1963
2.495
-0.376
-13.11%
jan 1, 1964
1.879
-0.616
-24.68%
jan 1, 1965
1.943
+0.064
3.41%
jan 1, 1966
1.495
-0.448
-23.05%
jan 1, 1967
1.654
+0.159
10.62%
jan 1, 1968
1.024
-0.63
-38.06%
jan 1, 1969
0.869
-0.155
-15.14%
jan 1, 1970
0.747
-0.123
-14.12%
jan 1, 1971
0.695
-0.052
-6.91%
jan 1, 1972
0.961
+0.266
38.26%
jan 1, 1973
0.987
+0.026
2.72%
jan 1, 1974
0.968
-0.019
-1.92%
jan 1, 1975
1.609
+0.641
66.25%
jan 1, 1976
2.363
+0.754
46.85%
jan 1, 1977
1.474
-0.889
-37.61%
jan 1, 1978
1.772
+0.297
20.17%
jan 1, 1979
1.476
-0.295
-16.67%
jan 1, 1980
1.08
-0.396
-26.85%
jan 1, 1981
1.419
+0.339
31.4%
jan 1, 1982
0.068
-1.351
-95.23%
jan 1, 1983
0.457
+0.39
575.38%
jan 1, 1984
0.034
-0.423
-92.54%
jan 1, 1985
0.078
+0.044
128.91%
jan 1, 1986
0.089
+0.011
13.44%
jan 1, 1987
0.067
-0.021
-23.95%
jan 1, 1988
0.061
-0.006
-9.22%
jan 1, 1989
0.215
+0.154
251.69%
jan 1, 1990
0.114
-0.101
-47.02%
jan 1, 1991
0.186
+0.072
63.38%
jan 1, 1992
0.173
-0.013
-7.04%
jan 1, 1993
0.057
-0.116
-67.18%
jan 1, 1994
0.142
+0.085
149.3%
jan 1, 1995
0.095
-0.046
-32.68%
jan 1, 1996
0.086
-0.009
-9.9%
jan 1, 1997
0.108
+0.022
25.97%
jan 1, 1998
0.13
+0.021
19.6%
jan 1, 1999
0.188
+0.058
44.78%
jan 1, 2000
0.256
+0.068
36.27%
jan 1, 2001
0.254
-0.001
-0.48%
jan 1, 2002
0.082
-0.172
-67.76%
jan 1, 2003
0.159
+0.077
94.03%
jan 1, 2004
0.146
-0.013
-8.39%
jan 1, 2005
0.087
-0.059
-40.44%
jan 1, 2006
0.144
+0.057
65.65%
jan 1, 2007
0.486
+0.342
237.72%
jan 1, 2008
0.146
-0.34
-69.93%
jan 1, 2009
0.328
+0.182
124.82%
jan 1, 2010
0.177
-0.151
-46.12%
jan 1, 2011
0.383
+0.206
116.36%
jan 1, 2012
0.317
-0.066
-17.19%
jan 1, 2013
0.53
+0.213
67.3%
jan 1, 2014
0.42
-0.11
-20.7%
jan 1, 2015
0.09
-0.33
-78.49%
Ranking of countries by current statistics by years


Comments: