29
/
en
AIzaSyAYiBZKx7MnpbEhh9jyipgxe19OcubqV5w
April 1, 2024
28345
East Asia & Pacific (excluding high income)
EAP
false
2
1
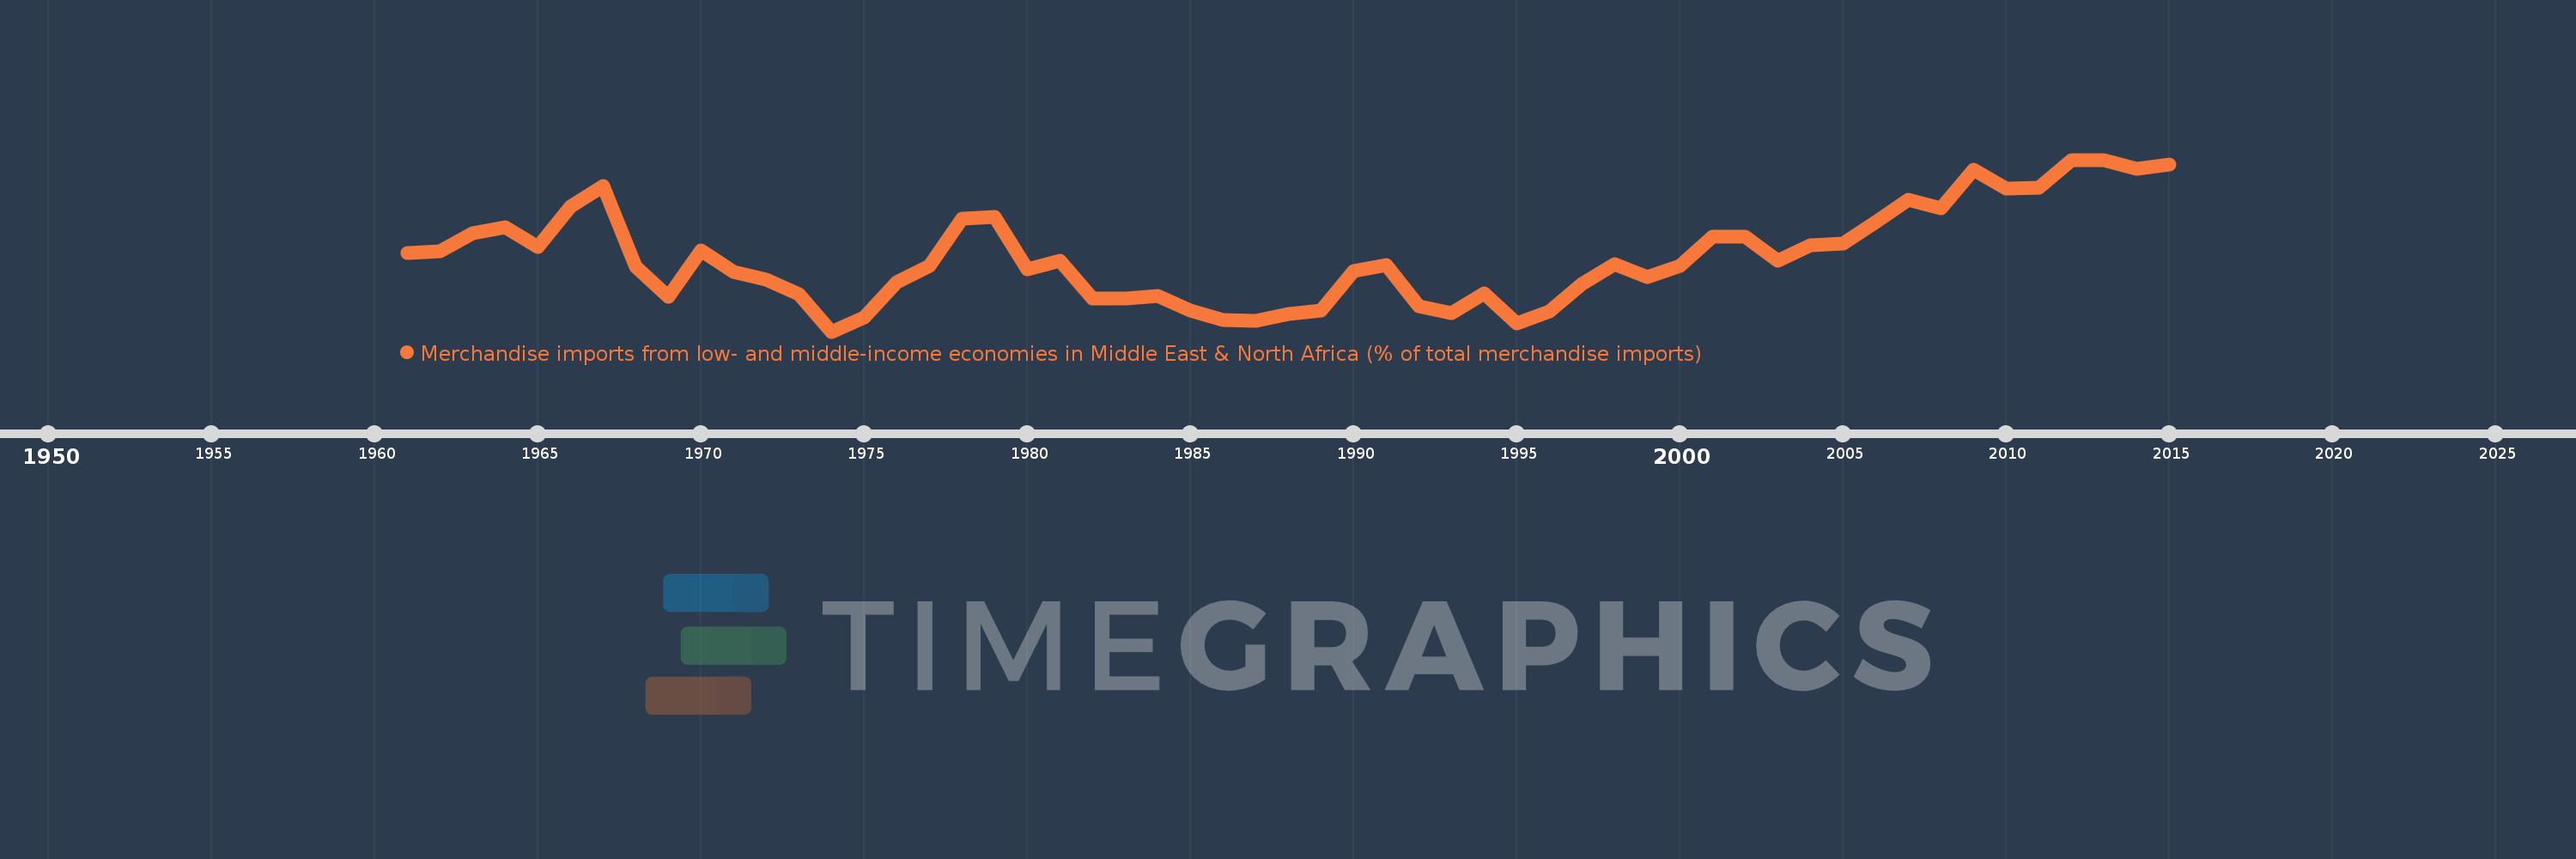
Merchandise imports from low- and middle-income economies in Middle East & North Africa (% of total merchandise imports)
2015,2014,2013,2012,2011,2010,2009,2008,2007,2006,2005,2004,2003,2002,2001,2000,1999,1998,1997,1996,1995,1994,1993,1992,1991,1990,1989,1988,1987,1986,1985,1984,1983,1982,1981,1980,1979,1978,1977,1976,1975,1974,1973,1972,1971,1970,1969,1968,1967,1966,1965,1964,1963,1962,1961
This statistics in other country:
AfghanistanAlbaniaAlgeriaAngolaArab WorldArgentinaArmeniaArubaAustraliaAustriaAzerbaijanBahamas, TheBahrainBangladeshBarbadosBelarusBelgiumBelizeBeninBermudaBoliviaBosnia and HerzegovinaBrazilBrunei DarussalamBulgariaBurkina FasoBurundiCabo VerdeCambodiaCameroonCanadaCaribbean small statesCentral African RepublicCentral Europe and the BalticsChadChileChinaColombiaComorosCongo, Dem. Rep.Congo, Rep.Costa RicaCote d'IvoireCroatiaCubaCyprusCzech RepublicDenmarkDjiboutiDominicaDominican RepublicEarly-demographic dividendEast Asia & PacificEast Asia & Pacific (excluding high income)East Asia & Pacific (IDA & IBRD countries)EcuadorEgypt, Arab Rep.El SalvadorEstoniaEthiopiaEuro areaEurope & Central AsiaEurope & Central Asia (excluding high income)Europe & Central Asia (IDA & IBRD countries)European UnionFijiFinlandFragile and conflict affected situationsFranceFrench PolynesiaGabonGambia, TheGeorgiaGermanyGhanaGreeceGreenlandGrenadaGuatemalaGuineaGuinea-BissauGuyanaHaitiHeavily indebted poor countries (HIPC)High incomeHondurasHong Kong SAR, ChinaHungaryIBRD onlyIcelandIDA & IBRD totalIDA blendIDA onlyIDA totalIndiaIndonesiaIran, Islamic Rep.IraqIrelandIsraelItalyJamaicaJapanJordanKazakhstanKenyaKorea, Dem. People’s Rep.Korea, Rep.KosovoKuwaitKyrgyz RepublicLao PDRLate-demographic dividendLatin America & Caribbean Latin America & Caribbean (excluding high income)Latin America & the Caribbean (IDA & IBRD countries)LatviaLeast developed countries: UN classificationLebanonLiberiaLibyaLithuaniaLow & middle incomeLow incomeLower middle incomeLuxembourgMacao SAR, ChinaMacedonia, FYRMadagascarMalawiMalaysiaMaldivesMaliMaltaMauritaniaMauritiusMexicoMiddle East & North AfricaMiddle East & North Africa (excluding high income)Middle East & North Africa (IDA & IBRD countries)Middle incomeMoldovaMongoliaMontenegroMoroccoMozambiqueMyanmarNepalNetherlandsNew CaledoniaNew ZealandNicaraguaNigerNigeriaNorth AmericaNorwayOECD membersOmanOther small statesPacific island small statesPakistanPanamaPapua New GuineaParaguayPeruPhilippinesPolandPortugalPost-demographic dividendPre-demographic dividendQatarRomaniaRussian FederationRwandaSamoaSaudi ArabiaSenegalSerbiaSeychellesSierra LeoneSingaporeSlovak RepublicSloveniaSmall statesSomaliaSouth AfricaSouth AsiaSouth Asia (IDA & IBRD)SpainSri LankaSt. Kitts and NevisSt. LuciaSt. Vincent and the GrenadinesSub-Saharan Africa Sub-Saharan Africa (excluding high income)Sub-Saharan Africa (IDA & IBRD countries)SudanSurinameSwedenSwitzerlandSyrian Arab RepublicTajikistanTanzaniaThailandTogoTrinidad and TobagoTunisiaTurkeyTurkmenistanUgandaUkraineUnited Arab EmiratesUnited KingdomUnited StatesUpper middle incomeUruguayUzbekistanVenezuela, RBVietnamWorldYemen, Rep.ZambiaZimbabwe Timeline:
This timeline shows a graph from 1961 to 2015 of East Asia & Pacific (excluding high income). No data until 1960. Number of actual observations by date: 55.
Source name:
World Development Indicators
Source organization:
World Bank staff estimates based data from International Monetary Fund's Direction of Trade database.
Categories, topics:
Private Sector, Trade
Last updated:
apr 23, 2017
Indicators value changes by year
At the date of observation
Value
Absolute change
Change from previous value
jan 1, 1961
1.157
+1.157
0.0%
jan 1, 1962
1.178
+0.021
1.79%
jan 1, 1963
1.383
+0.205
17.37%
jan 1, 1964
1.45
+0.067
4.86%
jan 1, 1965
1.222
-0.228
-15.72%
jan 1, 1966
1.679
+0.457
37.39%
jan 1, 1967
1.912
+0.234
13.92%
jan 1, 1968
1.002
-0.91
-47.59%
jan 1, 1969
0.664
-0.339
-33.8%
jan 1, 1970
1.185
+0.521
78.56%
jan 1, 1971
0.947
-0.238
-20.1%
jan 1, 1972
0.862
-0.085
-8.96%
jan 1, 1973
0.698
-0.164
-18.97%
jan 1, 1974
0.275
-0.424
-60.67%
jan 1, 1975
0.434
+0.159
57.95%
jan 1, 1976
0.826
+0.392
90.41%
jan 1, 1977
1.011
+0.185
22.45%
jan 1, 1978
1.546
+0.534
52.82%
jan 1, 1979
1.562
+0.016
1.04%
jan 1, 1980
0.97
-0.592
-37.89%
jan 1, 1981
1.073
+0.103
10.59%
jan 1, 1982
0.643
-0.429
-40.03%
jan 1, 1983
0.651
+0.008
1.19%
jan 1, 1984
0.678
+0.027
4.21%
jan 1, 1985
0.51
-0.168
-24.83%
jan 1, 1986
0.407
-0.103
-20.2%
jan 1, 1987
0.399
-0.008
-1.86%
jan 1, 1988
0.469
+0.07
17.44%
jan 1, 1989
0.515
+0.046
9.85%
jan 1, 1990
0.959
+0.444
86.09%
jan 1, 1991
1.019
+0.06
6.27%
jan 1, 1992
0.555
-0.464
-45.52%
jan 1, 1993
0.479
-0.076
-13.71%
jan 1, 1994
0.702
+0.223
46.62%
jan 1, 1995
0.366
-0.337
-47.96%
jan 1, 1996
0.499
+0.133
36.46%
jan 1, 1997
0.809
+0.31
62.15%
jan 1, 1998
1.033
+0.224
27.73%
jan 1, 1999
0.89
-0.143
-13.83%
jan 1, 2000
1.01
+0.12
13.42%
jan 1, 2001
1.345
+0.335
33.18%
jan 1, 2002
1.336
-0.009
-0.65%
jan 1, 2003
1.068
-0.268
-20.03%
jan 1, 2004
1.24
+0.171
16.05%
jan 1, 2005
1.261
+0.022
1.75%
jan 1, 2006
1.509
+0.248
19.63%
jan 1, 2007
1.752
+0.243
16.1%
jan 1, 2008
1.662
-0.09
-5.14%
jan 1, 2009
2.09
+0.428
25.76%
jan 1, 2010
1.882
-0.208
-9.94%
jan 1, 2011
1.893
+0.011
0.58%
jan 1, 2012
2.204
+0.311
16.42%
jan 1, 2013
2.198
-0.007
-0.3%
jan 1, 2014
2.105
-0.092
-4.19%
jan 1, 2015
2.154
+0.048
2.3%
Ranking of countries by current statistics by years


Comments: