29
/
en
AIzaSyAYiBZKx7MnpbEhh9jyipgxe19OcubqV5w
April 1, 2024
264882
Togo
TGO
true
2
1
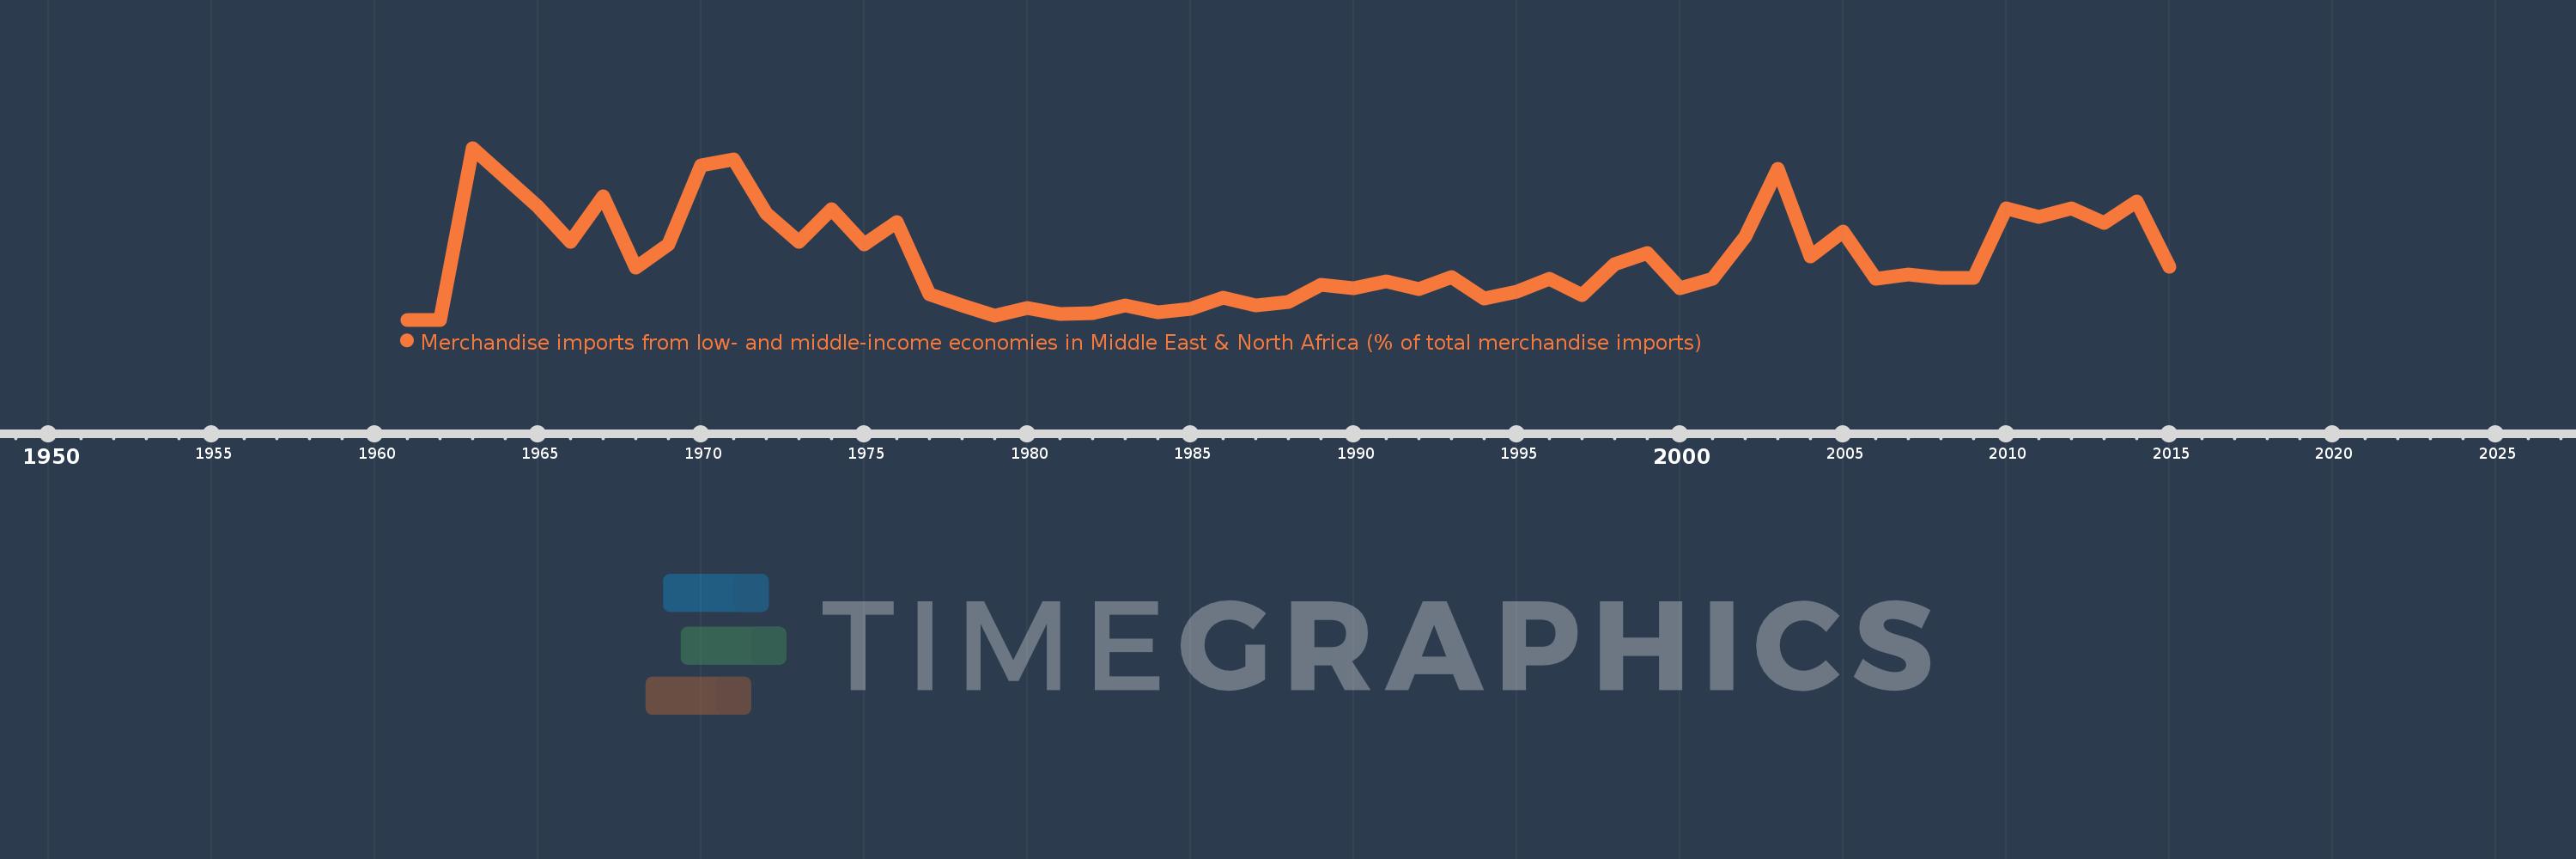
Merchandise imports from low- and middle-income economies in Middle East & North Africa (% of total merchandise imports)
2015,2014,2013,2012,2011,2010,2009,2008,2007,2006,2005,2004,2003,2002,2001,2000,1999,1998,1997,1996,1995,1994,1993,1992,1991,1990,1989,1988,1987,1986,1985,1984,1983,1982,1981,1980,1979,1978,1977,1976,1975,1974,1973,1972,1971,1970,1969,1968,1967,1966,1965,1964,1963,1962,1961
Global statistics library →Togo →Merchandise imports from low- and middle-income economies in Middle East & North Africa (% of total merchandise imports)
This statistics in other country:
AfghanistanAlbaniaAlgeriaAngolaArab WorldArgentinaArmeniaArubaAustraliaAustriaAzerbaijanBahamas, TheBahrainBangladeshBarbadosBelarusBelgiumBelizeBeninBermudaBoliviaBosnia and HerzegovinaBrazilBrunei DarussalamBulgariaBurkina FasoBurundiCabo VerdeCambodiaCameroonCanadaCaribbean small statesCentral African RepublicCentral Europe and the BalticsChadChileChinaColombiaComorosCongo, Dem. Rep.Congo, Rep.Costa RicaCote d'IvoireCroatiaCubaCyprusCzech RepublicDenmarkDjiboutiDominicaDominican RepublicEarly-demographic dividendEast Asia & PacificEast Asia & Pacific (excluding high income)East Asia & Pacific (IDA & IBRD countries)EcuadorEgypt, Arab Rep.El SalvadorEstoniaEthiopiaEuro areaEurope & Central AsiaEurope & Central Asia (excluding high income)Europe & Central Asia (IDA & IBRD countries)European UnionFijiFinlandFragile and conflict affected situationsFranceFrench PolynesiaGabonGambia, TheGeorgiaGermanyGhanaGreeceGreenlandGrenadaGuatemalaGuineaGuinea-BissauGuyanaHaitiHeavily indebted poor countries (HIPC)High incomeHondurasHong Kong SAR, ChinaHungaryIBRD onlyIcelandIDA & IBRD totalIDA blendIDA onlyIDA totalIndiaIndonesiaIran, Islamic Rep.IraqIrelandIsraelItalyJamaicaJapanJordanKazakhstanKenyaKorea, Dem. People’s Rep.Korea, Rep.KosovoKuwaitKyrgyz RepublicLao PDRLate-demographic dividendLatin America & Caribbean Latin America & Caribbean (excluding high income)Latin America & the Caribbean (IDA & IBRD countries)LatviaLeast developed countries: UN classificationLebanonLiberiaLibyaLithuaniaLow & middle incomeLow incomeLower middle incomeLuxembourgMacao SAR, ChinaMacedonia, FYRMadagascarMalawiMalaysiaMaldivesMaliMaltaMauritaniaMauritiusMexicoMiddle East & North AfricaMiddle East & North Africa (excluding high income)Middle East & North Africa (IDA & IBRD countries)Middle incomeMoldovaMongoliaMontenegroMoroccoMozambiqueMyanmarNepalNetherlandsNew CaledoniaNew ZealandNicaraguaNigerNigeriaNorth AmericaNorwayOECD membersOmanOther small statesPacific island small statesPakistanPanamaPapua New GuineaParaguayPeruPhilippinesPolandPortugalPost-demographic dividendPre-demographic dividendQatarRomaniaRussian FederationRwandaSamoaSaudi ArabiaSenegalSerbiaSeychellesSierra LeoneSingaporeSlovak RepublicSloveniaSmall statesSomaliaSouth AfricaSouth AsiaSouth Asia (IDA & IBRD)SpainSri LankaSt. Kitts and NevisSt. LuciaSt. Vincent and the GrenadinesSub-Saharan Africa Sub-Saharan Africa (excluding high income)Sub-Saharan Africa (IDA & IBRD countries)SudanSurinameSwedenSwitzerlandSyrian Arab RepublicTajikistanTanzaniaThailandTogoTrinidad and TobagoTunisiaTurkeyTurkmenistanUgandaUkraineUnited Arab EmiratesUnited KingdomUnited StatesUpper middle incomeUruguayUzbekistanVenezuela, RBVietnamWorldYemen, Rep.ZambiaZimbabwe Timeline:
This timeline shows a graph from 1961 to 2015 of Togo. No data until 1960. Number of actual observations by date: 55.
Source name:
World Development Indicators
Source organization:
World Bank staff estimates based data from International Monetary Fund's Direction of Trade database.
Categories, topics:
Private Sector, Trade
Last updated:
apr 23, 2017
Indicators value changes by year
At the date of observation
Value
Absolute change
Change from previous value
jan 1, 1963
2.952
+2.952
%
jan 1, 1964
2.439
-0.513
-17.38%
jan 1, 1965
1.937
-0.502
-20.58%
jan 1, 1966
1.336
-0.601
-31.01%
jan 1, 1967
2.123
+0.787
58.88%
jan 1, 1968
0.891
-1.232
-58.04%
jan 1, 1969
1.299
+0.408
45.78%
jan 1, 1970
2.647
+1.348
103.81%
jan 1, 1971
2.761
+0.114
4.32%
jan 1, 1972
1.829
-0.932
-33.75%
jan 1, 1973
1.338
-0.491
-26.85%
jan 1, 1974
1.901
+0.562
42.03%
jan 1, 1975
1.289
-0.612
-32.19%
jan 1, 1976
1.673
+0.384
29.8%
jan 1, 1977
0.438
-1.235
-73.82%
jan 1, 1978
0.252
-0.186
-42.56%
jan 1, 1979
0.07
-0.182
-72.36%
jan 1, 1980
0.205
+0.135
194.16%
jan 1, 1981
0.096
-0.109
-53.32%
jan 1, 1982
0.109
+0.013
13.79%
jan 1, 1983
0.251
+0.143
131.36%
jan 1, 1984
0.134
-0.117
-46.52%
jan 1, 1985
0.194
+0.06
44.32%
jan 1, 1986
0.379
+0.185
95.5%
jan 1, 1987
0.241
-0.138
-36.4%
jan 1, 1988
0.301
+0.059
24.55%
jan 1, 1989
0.606
+0.305
101.52%
jan 1, 1990
0.544
-0.061
-10.15%
jan 1, 1991
0.661
+0.116
21.37%
jan 1, 1992
0.527
-0.134
-20.26%
jan 1, 1993
0.73
+0.203
38.59%
jan 1, 1994
0.363
-0.367
-50.22%
jan 1, 1995
0.486
+0.123
33.72%
jan 1, 1996
0.701
+0.215
44.31%
jan 1, 1997
0.428
-0.274
-39.01%
jan 1, 1998
0.954
+0.526
123.05%
jan 1, 1999
1.143
+0.19
19.87%
jan 1, 2000
0.539
-0.604
-52.85%
jan 1, 2001
0.702
+0.162
30.14%
jan 1, 2002
1.432
+0.73
104.11%
jan 1, 2003
2.586
+1.154
80.59%
jan 1, 2004
1.094
-1.492
-57.71%
jan 1, 2005
1.511
+0.417
38.16%
jan 1, 2006
0.71
-0.801
-53.04%
jan 1, 2007
0.779
+0.069
9.75%
jan 1, 2008
0.726
-0.053
-6.82%
jan 1, 2009
0.72
-0.006
-0.87%
jan 1, 2010
1.92
+1.2
166.82%
jan 1, 2011
1.769
-0.151
-7.84%
jan 1, 2012
1.918
+0.148
8.38%
jan 1, 2013
1.657
-0.261
-13.6%
jan 1, 2014
2.028
+0.372
22.44%
jan 1, 2015
0.914
-1.114
-54.93%
Ranking of countries by current statistics by years


Comments: