29
/
en
AIzaSyAYiBZKx7MnpbEhh9jyipgxe19OcubqV5w
April 1, 2024
119170
Denmark
DNK
true
2
1
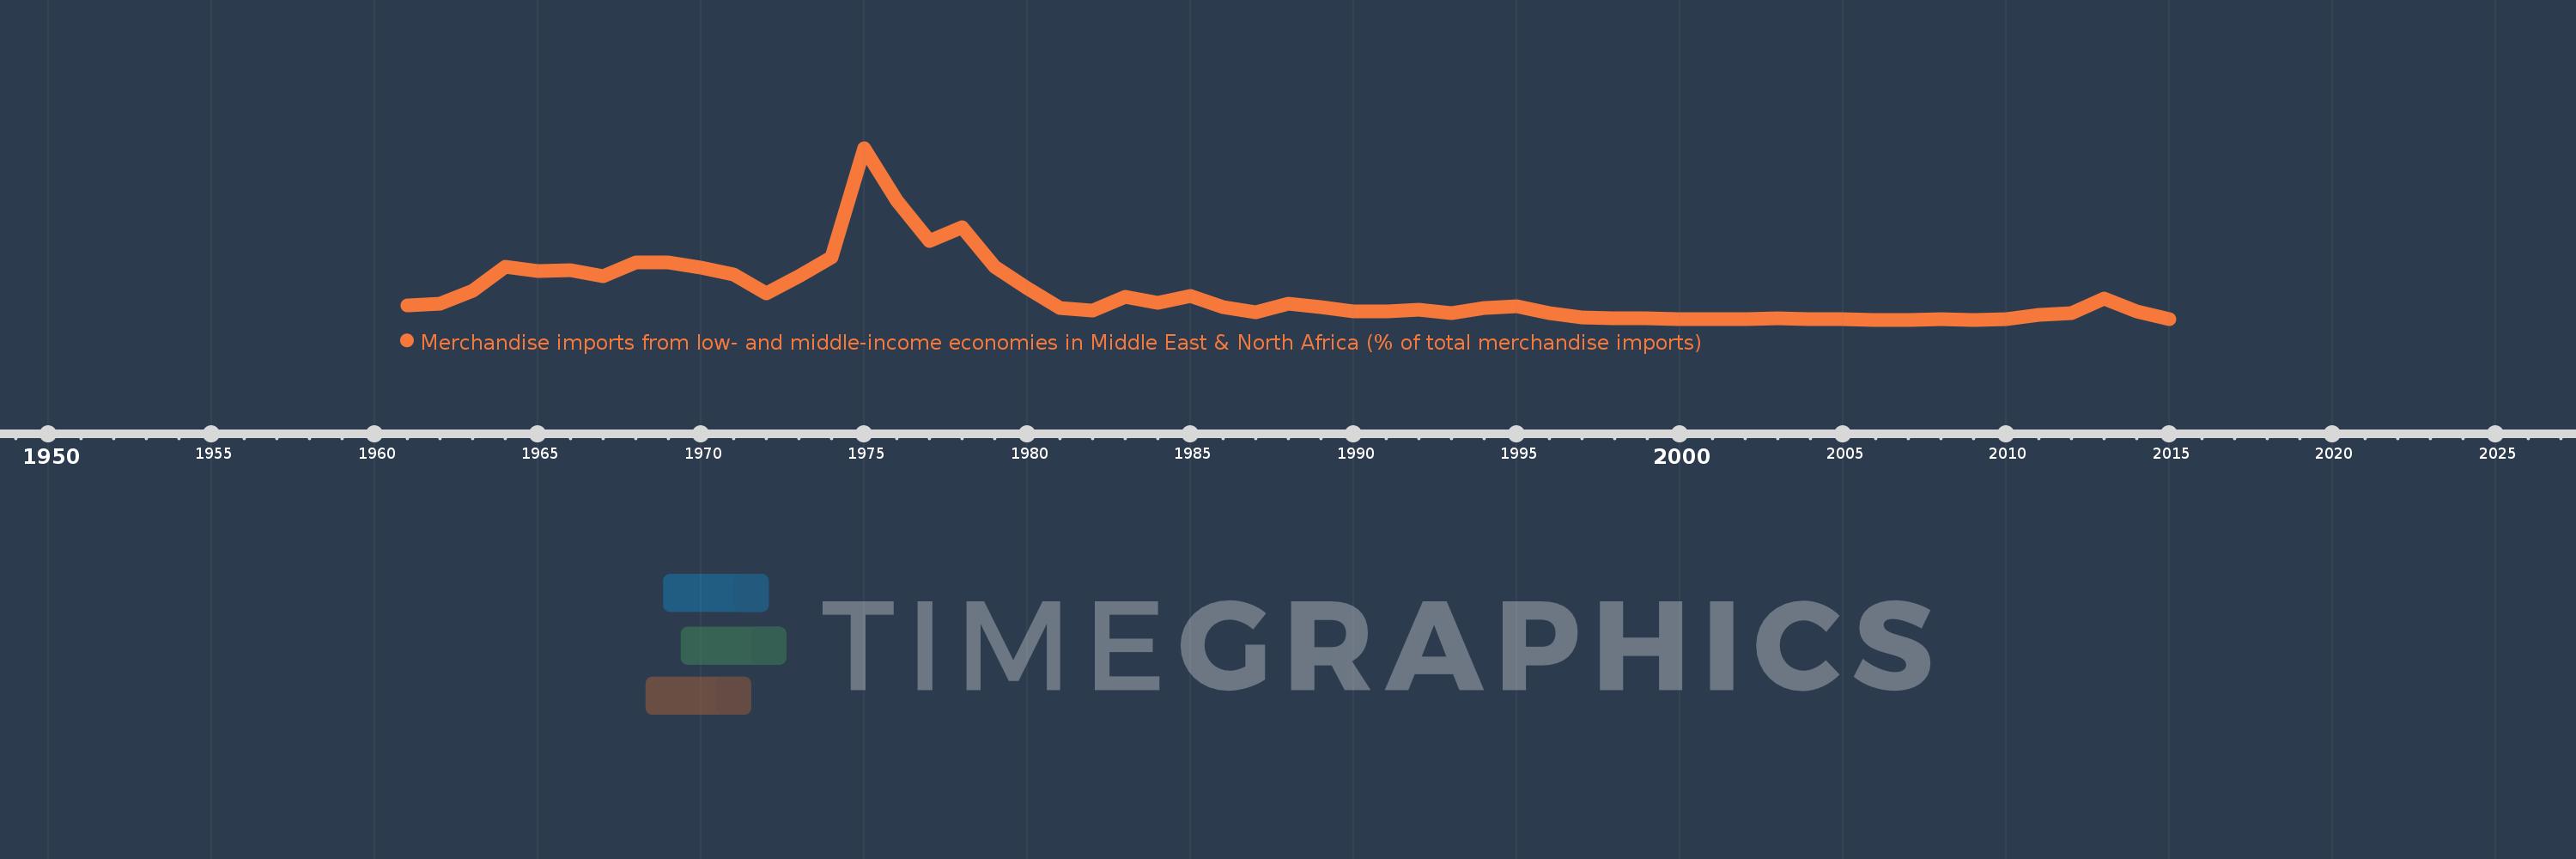
Merchandise imports from low- and middle-income economies in Middle East & North Africa (% of total merchandise imports)
2015,2014,2013,2012,2011,2010,2009,2008,2007,2006,2005,2004,2003,2002,2001,2000,1999,1998,1997,1996,1995,1994,1993,1992,1991,1990,1989,1988,1987,1986,1985,1984,1983,1982,1981,1980,1979,1978,1977,1976,1975,1974,1973,1972,1971,1970,1969,1968,1967,1966,1965,1964,1963,1962,1961
This statistics in other country:
AfghanistanAlbaniaAlgeriaAngolaArab WorldArgentinaArmeniaArubaAustraliaAustriaAzerbaijanBahamas, TheBahrainBangladeshBarbadosBelarusBelgiumBelizeBeninBermudaBoliviaBosnia and HerzegovinaBrazilBrunei DarussalamBulgariaBurkina FasoBurundiCabo VerdeCambodiaCameroonCanadaCaribbean small statesCentral African RepublicCentral Europe and the BalticsChadChileChinaColombiaComorosCongo, Dem. Rep.Congo, Rep.Costa RicaCote d'IvoireCroatiaCubaCyprusCzech RepublicDenmarkDjiboutiDominicaDominican RepublicEarly-demographic dividendEast Asia & PacificEast Asia & Pacific (excluding high income)East Asia & Pacific (IDA & IBRD countries)EcuadorEgypt, Arab Rep.El SalvadorEstoniaEthiopiaEuro areaEurope & Central AsiaEurope & Central Asia (excluding high income)Europe & Central Asia (IDA & IBRD countries)European UnionFijiFinlandFragile and conflict affected situationsFranceFrench PolynesiaGabonGambia, TheGeorgiaGermanyGhanaGreeceGreenlandGrenadaGuatemalaGuineaGuinea-BissauGuyanaHaitiHeavily indebted poor countries (HIPC)High incomeHondurasHong Kong SAR, ChinaHungaryIBRD onlyIcelandIDA & IBRD totalIDA blendIDA onlyIDA totalIndiaIndonesiaIran, Islamic Rep.IraqIrelandIsraelItalyJamaicaJapanJordanKazakhstanKenyaKorea, Dem. People’s Rep.Korea, Rep.KosovoKuwaitKyrgyz RepublicLao PDRLate-demographic dividendLatin America & Caribbean Latin America & Caribbean (excluding high income)Latin America & the Caribbean (IDA & IBRD countries)LatviaLeast developed countries: UN classificationLebanonLiberiaLibyaLithuaniaLow & middle incomeLow incomeLower middle incomeLuxembourgMacao SAR, ChinaMacedonia, FYRMadagascarMalawiMalaysiaMaldivesMaliMaltaMauritaniaMauritiusMexicoMiddle East & North AfricaMiddle East & North Africa (excluding high income)Middle East & North Africa (IDA & IBRD countries)Middle incomeMoldovaMongoliaMontenegroMoroccoMozambiqueMyanmarNepalNetherlandsNew CaledoniaNew ZealandNicaraguaNigerNigeriaNorth AmericaNorwayOECD membersOmanOther small statesPacific island small statesPakistanPanamaPapua New GuineaParaguayPeruPhilippinesPolandPortugalPost-demographic dividendPre-demographic dividendQatarRomaniaRussian FederationRwandaSamoaSaudi ArabiaSenegalSerbiaSeychellesSierra LeoneSingaporeSlovak RepublicSloveniaSmall statesSomaliaSouth AfricaSouth AsiaSouth Asia (IDA & IBRD)SpainSri LankaSt. Kitts and NevisSt. LuciaSt. Vincent and the GrenadinesSub-Saharan Africa Sub-Saharan Africa (excluding high income)Sub-Saharan Africa (IDA & IBRD countries)SudanSurinameSwedenSwitzerlandSyrian Arab RepublicTajikistanTanzaniaThailandTogoTrinidad and TobagoTunisiaTurkeyTurkmenistanUgandaUkraineUnited Arab EmiratesUnited KingdomUnited StatesUpper middle incomeUruguayUzbekistanVenezuela, RBVietnamWorldYemen, Rep.ZambiaZimbabwe Timeline:
This timeline shows a graph from 1961 to 2015 of Denmark. No data until 1960. Number of actual observations by date: 55.
Source name:
World Development Indicators
Source organization:
World Bank staff estimates based data from International Monetary Fund's Direction of Trade database.
Categories, topics:
Private Sector, Trade
Last updated:
apr 23, 2017
Indicators value changes by year
At the date of observation
Value
Absolute change
Change from previous value
jan 1, 1961
0.445
+0.445
0.0%
jan 1, 1962
0.493
+0.048
10.68%
jan 1, 1963
0.828
+0.335
68.1%
jan 1, 1964
1.472
+0.644
77.83%
jan 1, 1965
1.372
-0.101
-6.84%
jan 1, 1966
1.39
+0.019
1.35%
jan 1, 1967
1.216
-0.174
-12.5%
jan 1, 1968
1.591
+0.374
30.77%
jan 1, 1969
1.589
-0.001
-0.08%
jan 1, 1970
1.452
-0.138
-8.67%
jan 1, 1971
1.266
-0.186
-12.78%
jan 1, 1972
0.755
-0.511
-40.39%
jan 1, 1973
1.232
+0.477
63.17%
jan 1, 1974
1.73
+0.498
40.47%
jan 1, 1975
4.665
+2.935
169.64%
jan 1, 1976
3.258
-1.407
-30.16%
jan 1, 1977
2.165
-1.092
-33.53%
jan 1, 1978
2.543
+0.377
17.43%
jan 1, 1979
1.469
-1.073
-42.21%
jan 1, 1980
0.895
-0.574
-39.09%
jan 1, 1981
0.38
-0.515
-57.49%
jan 1, 1982
0.305
-0.076
-19.92%
jan 1, 1983
0.665
+0.36
118.15%
jan 1, 1984
0.504
-0.161
-24.2%
jan 1, 1985
0.682
+0.178
35.39%
jan 1, 1986
0.384
-0.298
-43.71%
jan 1, 1987
0.25
-0.134
-34.88%
jan 1, 1988
0.478
+0.228
91.11%
jan 1, 1989
0.39
-0.088
-18.35%
jan 1, 1990
0.273
-0.118
-30.14%
jan 1, 1991
0.286
+0.013
4.8%
jan 1, 1992
0.323
+0.037
12.91%
jan 1, 1993
0.239
-0.084
-25.94%
jan 1, 1994
0.36
+0.121
50.69%
jan 1, 1995
0.426
+0.066
18.42%
jan 1, 1996
0.226
-0.2
-46.99%
jan 1, 1997
0.116
-0.11
-48.52%
jan 1, 1998
0.083
-0.034
-28.81%
jan 1, 1999
0.086
+0.003
4.13%
jan 1, 2000
0.078
-0.008
-9.81%
jan 1, 2001
0.077
-0.001
-1.3%
jan 1, 2002
0.072
-0.004
-5.77%
jan 1, 2003
0.088
+0.016
21.43%
jan 1, 2004
0.076
-0.011
-12.91%
jan 1, 2005
0.069
-0.008
-10.15%
jan 1, 2006
0.054
-0.015
-21.16%
jan 1, 2007
0.055
+0.001
2.13%
jan 1, 2008
0.062
+0.007
12.6%
jan 1, 2009
0.058
-0.004
-7.11%
jan 1, 2010
0.069
+0.011
18.71%
jan 1, 2011
0.184
+0.116
168.2%
jan 1, 2012
0.242
+0.058
31.52%
jan 1, 2013
0.625
+0.383
157.84%
jan 1, 2014
0.277
-0.348
-55.65%
jan 1, 2015
0.077
-0.2
-72.06%
Ranking of countries by current statistics by years


Comments: