29
/
en
AIzaSyAYiBZKx7MnpbEhh9jyipgxe19OcubqV5w
April 1, 2024
98879
Cambodia
KHM
true
2
1
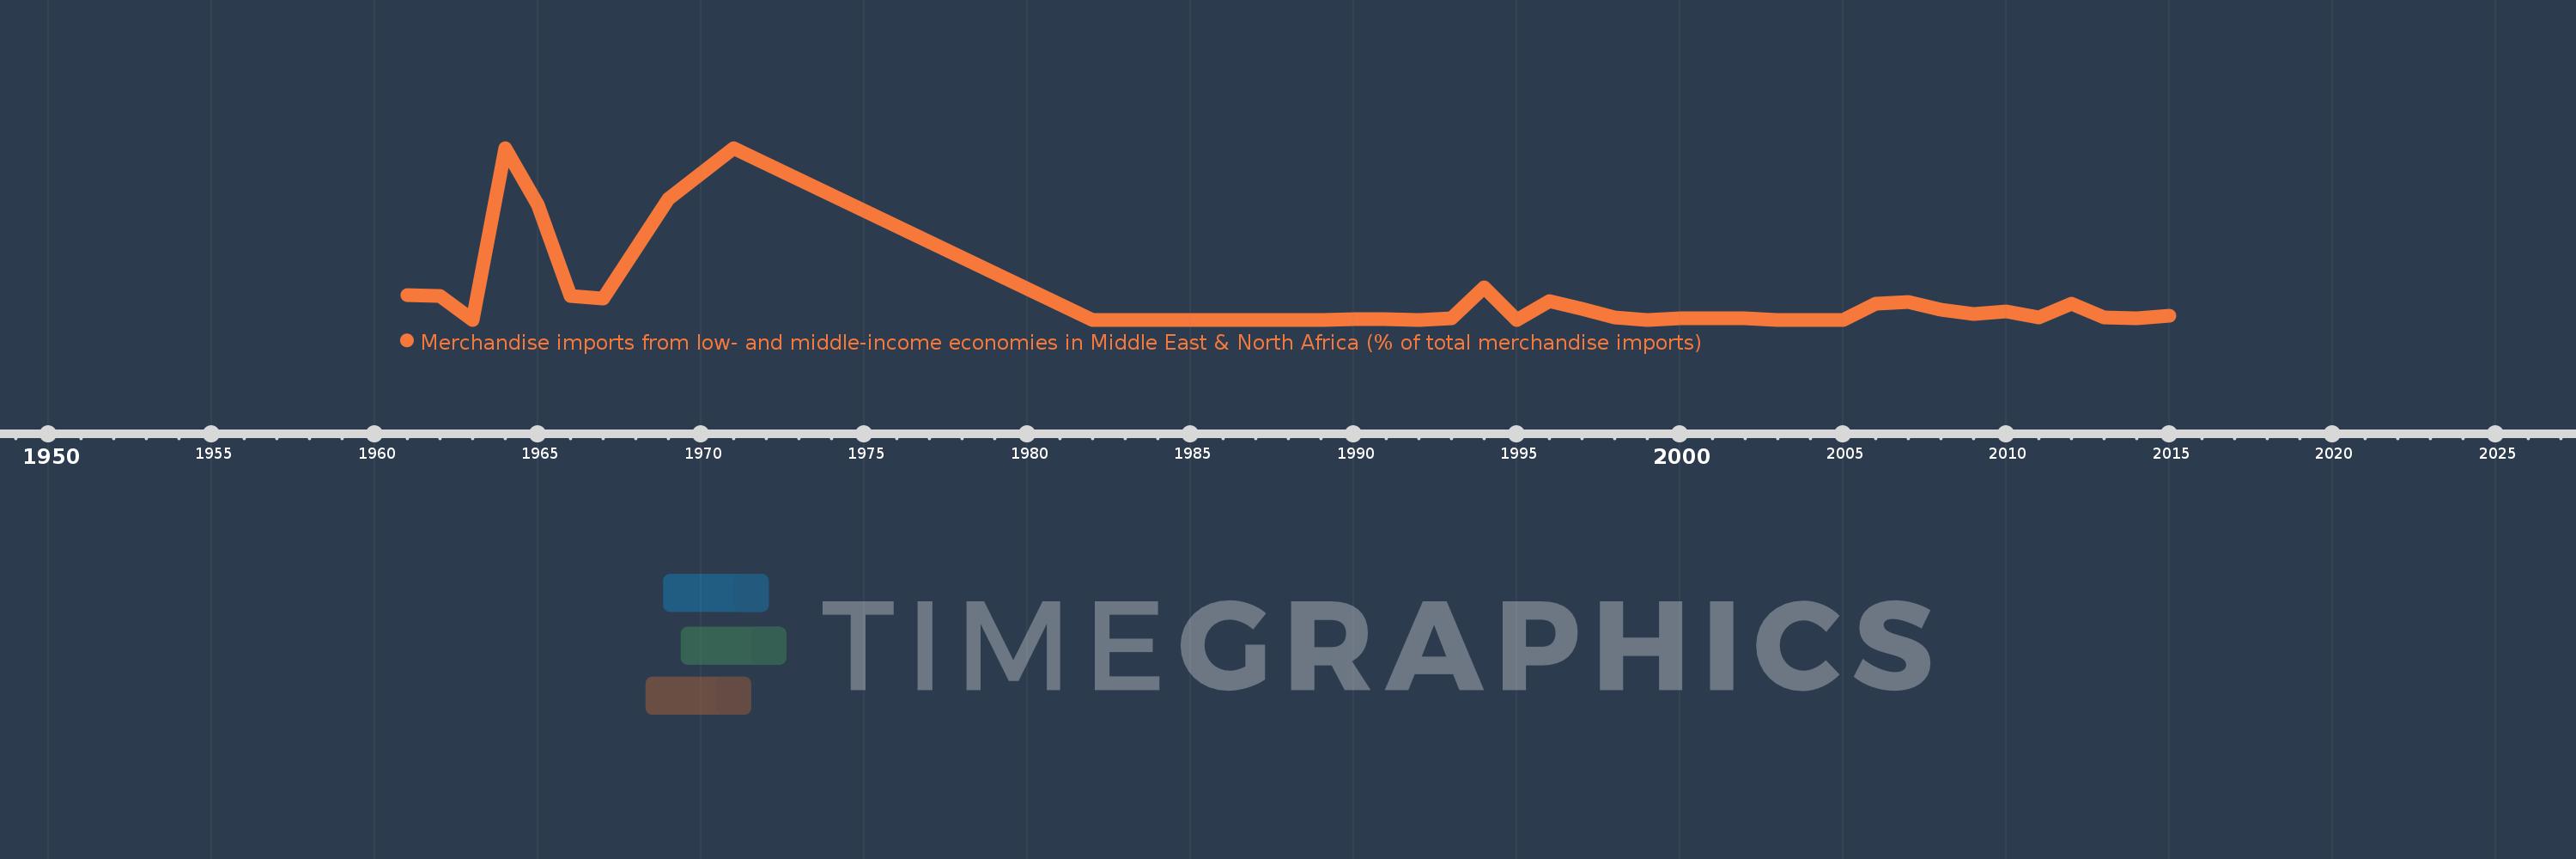
Merchandise imports from low- and middle-income economies in Middle East & North Africa (% of total merchandise imports)
2015,2014,2013,2012,2011,2010,2009,2008,2007,2006,2005,2004,2003,2002,2001,2000,1999,1998,1997,1996,1995,1994,1993,1992,1991,1990,1989,1988,1987,1986,1985,1984,1983,1982,1971,1969,1967,1966,1965,1964,1963,1962,1961
This statistics in other country:
AfghanistanAlbaniaAlgeriaAngolaArab WorldArgentinaArmeniaArubaAustraliaAustriaAzerbaijanBahamas, TheBahrainBangladeshBarbadosBelarusBelgiumBelizeBeninBermudaBoliviaBosnia and HerzegovinaBrazilBrunei DarussalamBulgariaBurkina FasoBurundiCabo VerdeCambodiaCameroonCanadaCaribbean small statesCentral African RepublicCentral Europe and the BalticsChadChileChinaColombiaComorosCongo, Dem. Rep.Congo, Rep.Costa RicaCote d'IvoireCroatiaCubaCyprusCzech RepublicDenmarkDjiboutiDominicaDominican RepublicEarly-demographic dividendEast Asia & PacificEast Asia & Pacific (excluding high income)East Asia & Pacific (IDA & IBRD countries)EcuadorEgypt, Arab Rep.El SalvadorEstoniaEthiopiaEuro areaEurope & Central AsiaEurope & Central Asia (excluding high income)Europe & Central Asia (IDA & IBRD countries)European UnionFijiFinlandFragile and conflict affected situationsFranceFrench PolynesiaGabonGambia, TheGeorgiaGermanyGhanaGreeceGreenlandGrenadaGuatemalaGuineaGuinea-BissauGuyanaHaitiHeavily indebted poor countries (HIPC)High incomeHondurasHong Kong SAR, ChinaHungaryIBRD onlyIcelandIDA & IBRD totalIDA blendIDA onlyIDA totalIndiaIndonesiaIran, Islamic Rep.IraqIrelandIsraelItalyJamaicaJapanJordanKazakhstanKenyaKorea, Dem. People’s Rep.Korea, Rep.KosovoKuwaitKyrgyz RepublicLao PDRLate-demographic dividendLatin America & Caribbean Latin America & Caribbean (excluding high income)Latin America & the Caribbean (IDA & IBRD countries)LatviaLeast developed countries: UN classificationLebanonLiberiaLibyaLithuaniaLow & middle incomeLow incomeLower middle incomeLuxembourgMacao SAR, ChinaMacedonia, FYRMadagascarMalawiMalaysiaMaldivesMaliMaltaMauritaniaMauritiusMexicoMiddle East & North AfricaMiddle East & North Africa (excluding high income)Middle East & North Africa (IDA & IBRD countries)Middle incomeMoldovaMongoliaMontenegroMoroccoMozambiqueMyanmarNepalNetherlandsNew CaledoniaNew ZealandNicaraguaNigerNigeriaNorth AmericaNorwayOECD membersOmanOther small statesPacific island small statesPakistanPanamaPapua New GuineaParaguayPeruPhilippinesPolandPortugalPost-demographic dividendPre-demographic dividendQatarRomaniaRussian FederationRwandaSamoaSaudi ArabiaSenegalSerbiaSeychellesSierra LeoneSingaporeSlovak RepublicSloveniaSmall statesSomaliaSouth AfricaSouth AsiaSouth Asia (IDA & IBRD)SpainSri LankaSt. Kitts and NevisSt. LuciaSt. Vincent and the GrenadinesSub-Saharan Africa Sub-Saharan Africa (excluding high income)Sub-Saharan Africa (IDA & IBRD countries)SudanSurinameSwedenSwitzerlandSyrian Arab RepublicTajikistanTanzaniaThailandTogoTrinidad and TobagoTunisiaTurkeyTurkmenistanUgandaUkraineUnited Arab EmiratesUnited KingdomUnited StatesUpper middle incomeUruguayUzbekistanVenezuela, RBVietnamWorldYemen, Rep.ZambiaZimbabwe Timeline:
This timeline shows a graph from 1961 to 2015 of Cambodia. No data until 1960. Number of actual observations by date: 43.
Source name:
World Development Indicators
Source organization:
World Bank staff estimates based data from International Monetary Fund's Direction of Trade database.
Categories, topics:
Private Sector, Trade
Last updated:
apr 23, 2017
Indicators value changes by year
At the date of observation
Value
Absolute change
Change from previous value
jan 1, 1961
0.107
+0.107
0.0%
jan 1, 1962
0.103
-0.004
-3.6%
jan 1, 1963
0.0
-0.103
-100.0%
jan 1, 1964
0.756
+0.756
%
jan 1, 1965
0.504
-0.252
-33.38%
jan 1, 1966
0.103
-0.401
-79.56%
jan 1, 1967
0.094
-0.009
-9.17%
jan 1, 1969
0.53
+0.436
466.11%
jan 1, 1971
0.754
+0.225
42.47%
jan 1, 1982
0.0
-0.754
-100.0%
jan 1, 1990
0.004
+0.004
%
jan 1, 1991
0.004
0.0
-7.4%
jan 1, 1992
0.0
-0.004
-100.0%
jan 1, 1993
0.007
+0.007
%
jan 1, 1994
0.143
+0.136
1.85K%
jan 1, 1995
0.0
-0.143
-99.8%
jan 1, 1996
0.081
+0.081
28.33K%
jan 1, 1997
0.047
-0.035
-42.78%
jan 1, 1998
0.01
-0.037
-78.87%
jan 1, 1999
0.0
-0.01
-100.0%
jan 1, 2000
0.005
+0.005
%
jan 1, 2001
0.006
+0.001
17.33%
jan 1, 2002
0.006
+0.001
9.18%
jan 1, 2003
0.0
-0.006
-100.0%
jan 1, 2007
0.08
+0.01
14.66%
jan 1, 2008
0.046
-0.034
-42.54%
jan 1, 2009
0.025
-0.021
-44.77%
jan 1, 2010
0.035
+0.01
38.93%
jan 1, 2011
0.011
-0.024
-69.01%
jan 1, 2012
0.07
+0.059
542.11%
jan 1, 2013
0.01
-0.06
-85.81%
jan 1, 2014
0.007
-0.003
-26.98%
jan 1, 2015
0.017
+0.01
131.45%
Ranking of countries by current statistics by years


Comments: