29
/
en
AIzaSyAYiBZKx7MnpbEhh9jyipgxe19OcubqV5w
April 1, 2024
223868
Philippines
PHL
true
2
1
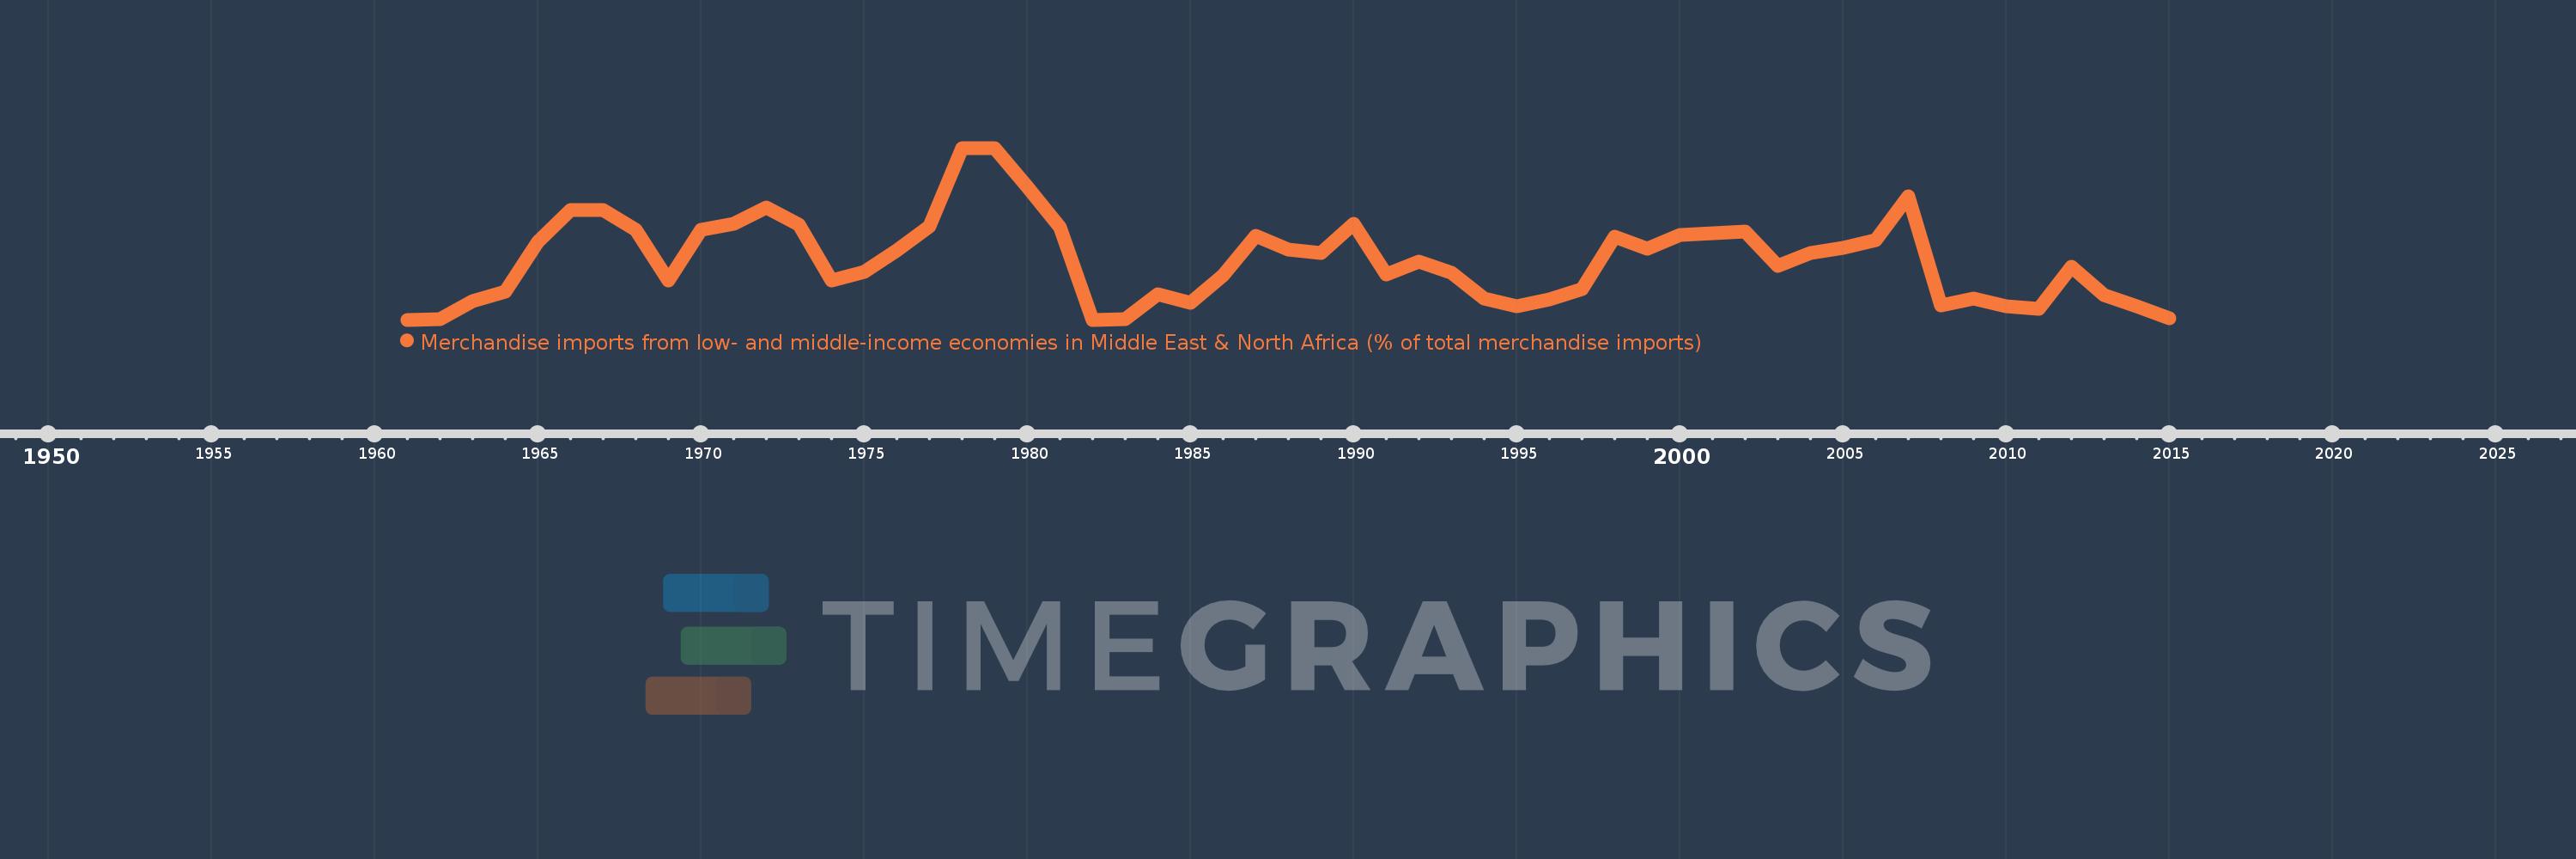
Merchandise imports from low- and middle-income economies in Middle East & North Africa (% of total merchandise imports)
2015,2014,2013,2012,2011,2010,2009,2008,2007,2006,2005,2004,2003,2002,2001,2000,1999,1998,1997,1996,1995,1994,1993,1992,1991,1990,1989,1988,1987,1986,1985,1984,1983,1982,1981,1980,1979,1978,1977,1976,1975,1974,1973,1972,1971,1970,1969,1968,1967,1966,1965,1964,1963,1962,1961
This statistics in other country:
AfghanistanAlbaniaAlgeriaAngolaArab WorldArgentinaArmeniaArubaAustraliaAustriaAzerbaijanBahamas, TheBahrainBangladeshBarbadosBelarusBelgiumBelizeBeninBermudaBoliviaBosnia and HerzegovinaBrazilBrunei DarussalamBulgariaBurkina FasoBurundiCabo VerdeCambodiaCameroonCanadaCaribbean small statesCentral African RepublicCentral Europe and the BalticsChadChileChinaColombiaComorosCongo, Dem. Rep.Congo, Rep.Costa RicaCote d'IvoireCroatiaCubaCyprusCzech RepublicDenmarkDjiboutiDominicaDominican RepublicEarly-demographic dividendEast Asia & PacificEast Asia & Pacific (excluding high income)East Asia & Pacific (IDA & IBRD countries)EcuadorEgypt, Arab Rep.El SalvadorEstoniaEthiopiaEuro areaEurope & Central AsiaEurope & Central Asia (excluding high income)Europe & Central Asia (IDA & IBRD countries)European UnionFijiFinlandFragile and conflict affected situationsFranceFrench PolynesiaGabonGambia, TheGeorgiaGermanyGhanaGreeceGreenlandGrenadaGuatemalaGuineaGuinea-BissauGuyanaHaitiHeavily indebted poor countries (HIPC)High incomeHondurasHong Kong SAR, ChinaHungaryIBRD onlyIcelandIDA & IBRD totalIDA blendIDA onlyIDA totalIndiaIndonesiaIran, Islamic Rep.IraqIrelandIsraelItalyJamaicaJapanJordanKazakhstanKenyaKorea, Dem. People’s Rep.Korea, Rep.KosovoKuwaitKyrgyz RepublicLao PDRLate-demographic dividendLatin America & Caribbean Latin America & Caribbean (excluding high income)Latin America & the Caribbean (IDA & IBRD countries)LatviaLeast developed countries: UN classificationLebanonLiberiaLibyaLithuaniaLow & middle incomeLow incomeLower middle incomeLuxembourgMacao SAR, ChinaMacedonia, FYRMadagascarMalawiMalaysiaMaldivesMaliMaltaMauritaniaMauritiusMexicoMiddle East & North AfricaMiddle East & North Africa (excluding high income)Middle East & North Africa (IDA & IBRD countries)Middle incomeMoldovaMongoliaMontenegroMoroccoMozambiqueMyanmarNepalNetherlandsNew CaledoniaNew ZealandNicaraguaNigerNigeriaNorth AmericaNorwayOECD membersOmanOther small statesPacific island small statesPakistanPanamaPapua New GuineaParaguayPeruPhilippinesPolandPortugalPost-demographic dividendPre-demographic dividendQatarRomaniaRussian FederationRwandaSamoaSaudi ArabiaSenegalSerbiaSeychellesSierra LeoneSingaporeSlovak RepublicSloveniaSmall statesSomaliaSouth AfricaSouth AsiaSouth Asia (IDA & IBRD)SpainSri LankaSt. Kitts and NevisSt. LuciaSt. Vincent and the GrenadinesSub-Saharan Africa Sub-Saharan Africa (excluding high income)Sub-Saharan Africa (IDA & IBRD countries)SudanSurinameSwedenSwitzerlandSyrian Arab RepublicTajikistanTanzaniaThailandTogoTrinidad and TobagoTunisiaTurkeyTurkmenistanUgandaUkraineUnited Arab EmiratesUnited KingdomUnited StatesUpper middle incomeUruguayUzbekistanVenezuela, RBVietnamWorldYemen, Rep.ZambiaZimbabwe Timeline:
This timeline shows a graph from 1961 to 2015 of Philippines. No data until 1960. Number of actual observations by date: 55.
Source name:
World Development Indicators
Source organization:
World Bank staff estimates based data from International Monetary Fund's Direction of Trade database.
Categories, topics:
Private Sector, Trade
Last updated:
apr 23, 2017
Indicators value changes by year
At the date of observation
Value
Absolute change
Change from previous value
jan 1, 1962
0.015
+0.015
%
jan 1, 1963
0.51
+0.495
3.35K%
jan 1, 1964
0.769
+0.258
50.66%
jan 1, 1965
2.122
+1.354
176.08%
jan 1, 1966
2.978
+0.856
40.31%
jan 1, 1967
2.969
-0.009
-0.31%
jan 1, 1968
2.443
-0.526
-17.71%
jan 1, 1969
1.064
-1.379
-56.44%
jan 1, 1970
2.431
+1.367
128.42%
jan 1, 1971
2.615
+0.184
7.56%
jan 1, 1972
3.057
+0.442
16.92%
jan 1, 1973
2.581
-0.476
-15.58%
jan 1, 1974
1.056
-1.525
-59.09%
jan 1, 1975
1.304
+0.248
23.47%
jan 1, 1976
1.885
+0.581
44.57%
jan 1, 1977
2.534
+0.649
34.42%
jan 1, 1978
4.663
+2.129
84.01%
jan 1, 1979
4.659
-0.004
-0.09%
jan 1, 1980
3.608
-1.051
-22.56%
jan 1, 1981
2.5
-1.108
-30.7%
jan 1, 1982
0.001
-2.499
-99.96%
jan 1, 1983
0.006
+0.005
502.78%
jan 1, 1984
0.698
+0.692
12.17K%
jan 1, 1985
0.462
-0.236
-33.8%
jan 1, 1986
1.213
+0.751
162.59%
jan 1, 1987
2.283
+1.07
88.2%
jan 1, 1988
1.895
-0.388
-17.01%
jan 1, 1989
1.804
-0.091
-4.81%
jan 1, 1990
2.615
+0.811
44.97%
jan 1, 1991
1.221
-1.394
-53.3%
jan 1, 1992
1.584
+0.363
29.74%
jan 1, 1993
1.286
-0.298
-18.83%
jan 1, 1994
0.572
-0.714
-55.55%
jan 1, 1995
0.361
-0.211
-36.9%
jan 1, 1996
0.551
+0.19
52.77%
jan 1, 1997
0.825
+0.274
49.79%
jan 1, 1998
2.256
+1.43
173.3%
jan 1, 1999
1.923
-0.332
-14.74%
jan 1, 2000
2.291
+0.368
19.14%
jan 1, 2001
2.35
+0.059
2.58%
jan 1, 2002
2.404
+0.054
2.3%
jan 1, 2003
1.453
-0.952
-39.59%
jan 1, 2004
1.815
+0.363
24.98%
jan 1, 2005
1.948
+0.133
7.31%
jan 1, 2006
2.165
+0.217
11.16%
jan 1, 2007
3.339
+1.174
54.23%
jan 1, 2008
0.381
-2.958
-88.58%
jan 1, 2009
0.582
+0.201
52.66%
jan 1, 2010
0.359
-0.224
-38.42%
jan 1, 2011
0.293
-0.065
-18.22%
jan 1, 2012
1.444
+1.151
392.36%
jan 1, 2013
0.668
-0.776
-53.72%
jan 1, 2014
0.364
-0.305
-45.58%
jan 1, 2015
0.038
-0.325
-89.45%
Ranking of countries by current statistics by years


Comments: